Phenotypic diversity
Motivation
The focus so far was on the analysis of genetic variation of genebank resources. However, ultimately, the phenotype is what is important in PGR. This includes yield, product quality, disease resistance, abiotic stress tolerance and many other traits. Plant genetic resources are commonly viewed as new sources of genetic variation for these traits, and for this reason, the ability to efficiently characterize phenotypic variation of plant genetic resources is of central importance for their further utilization.
Given the large diversity of genetic resources for a given species that may be distributed in situ or in different ex situ genebanks, a big challenge is to find approaches for efficient phenotyping, given that available resources are usually limited and numbers (of genebank accessions) are large.
In recent years, the phenotyping of plants has made a rapid progress, and in the context of PGR, the term genebank phenomics was created for the large scale phenotyping of diverse and exotic plant material Nguyen and Norton (2020).
The purpose of this chapter is to introduce the main strategies for large-scale phenotypic analysis of genetic resources, provide an overview over major phenotyping technologies and the issues associated with data storage.
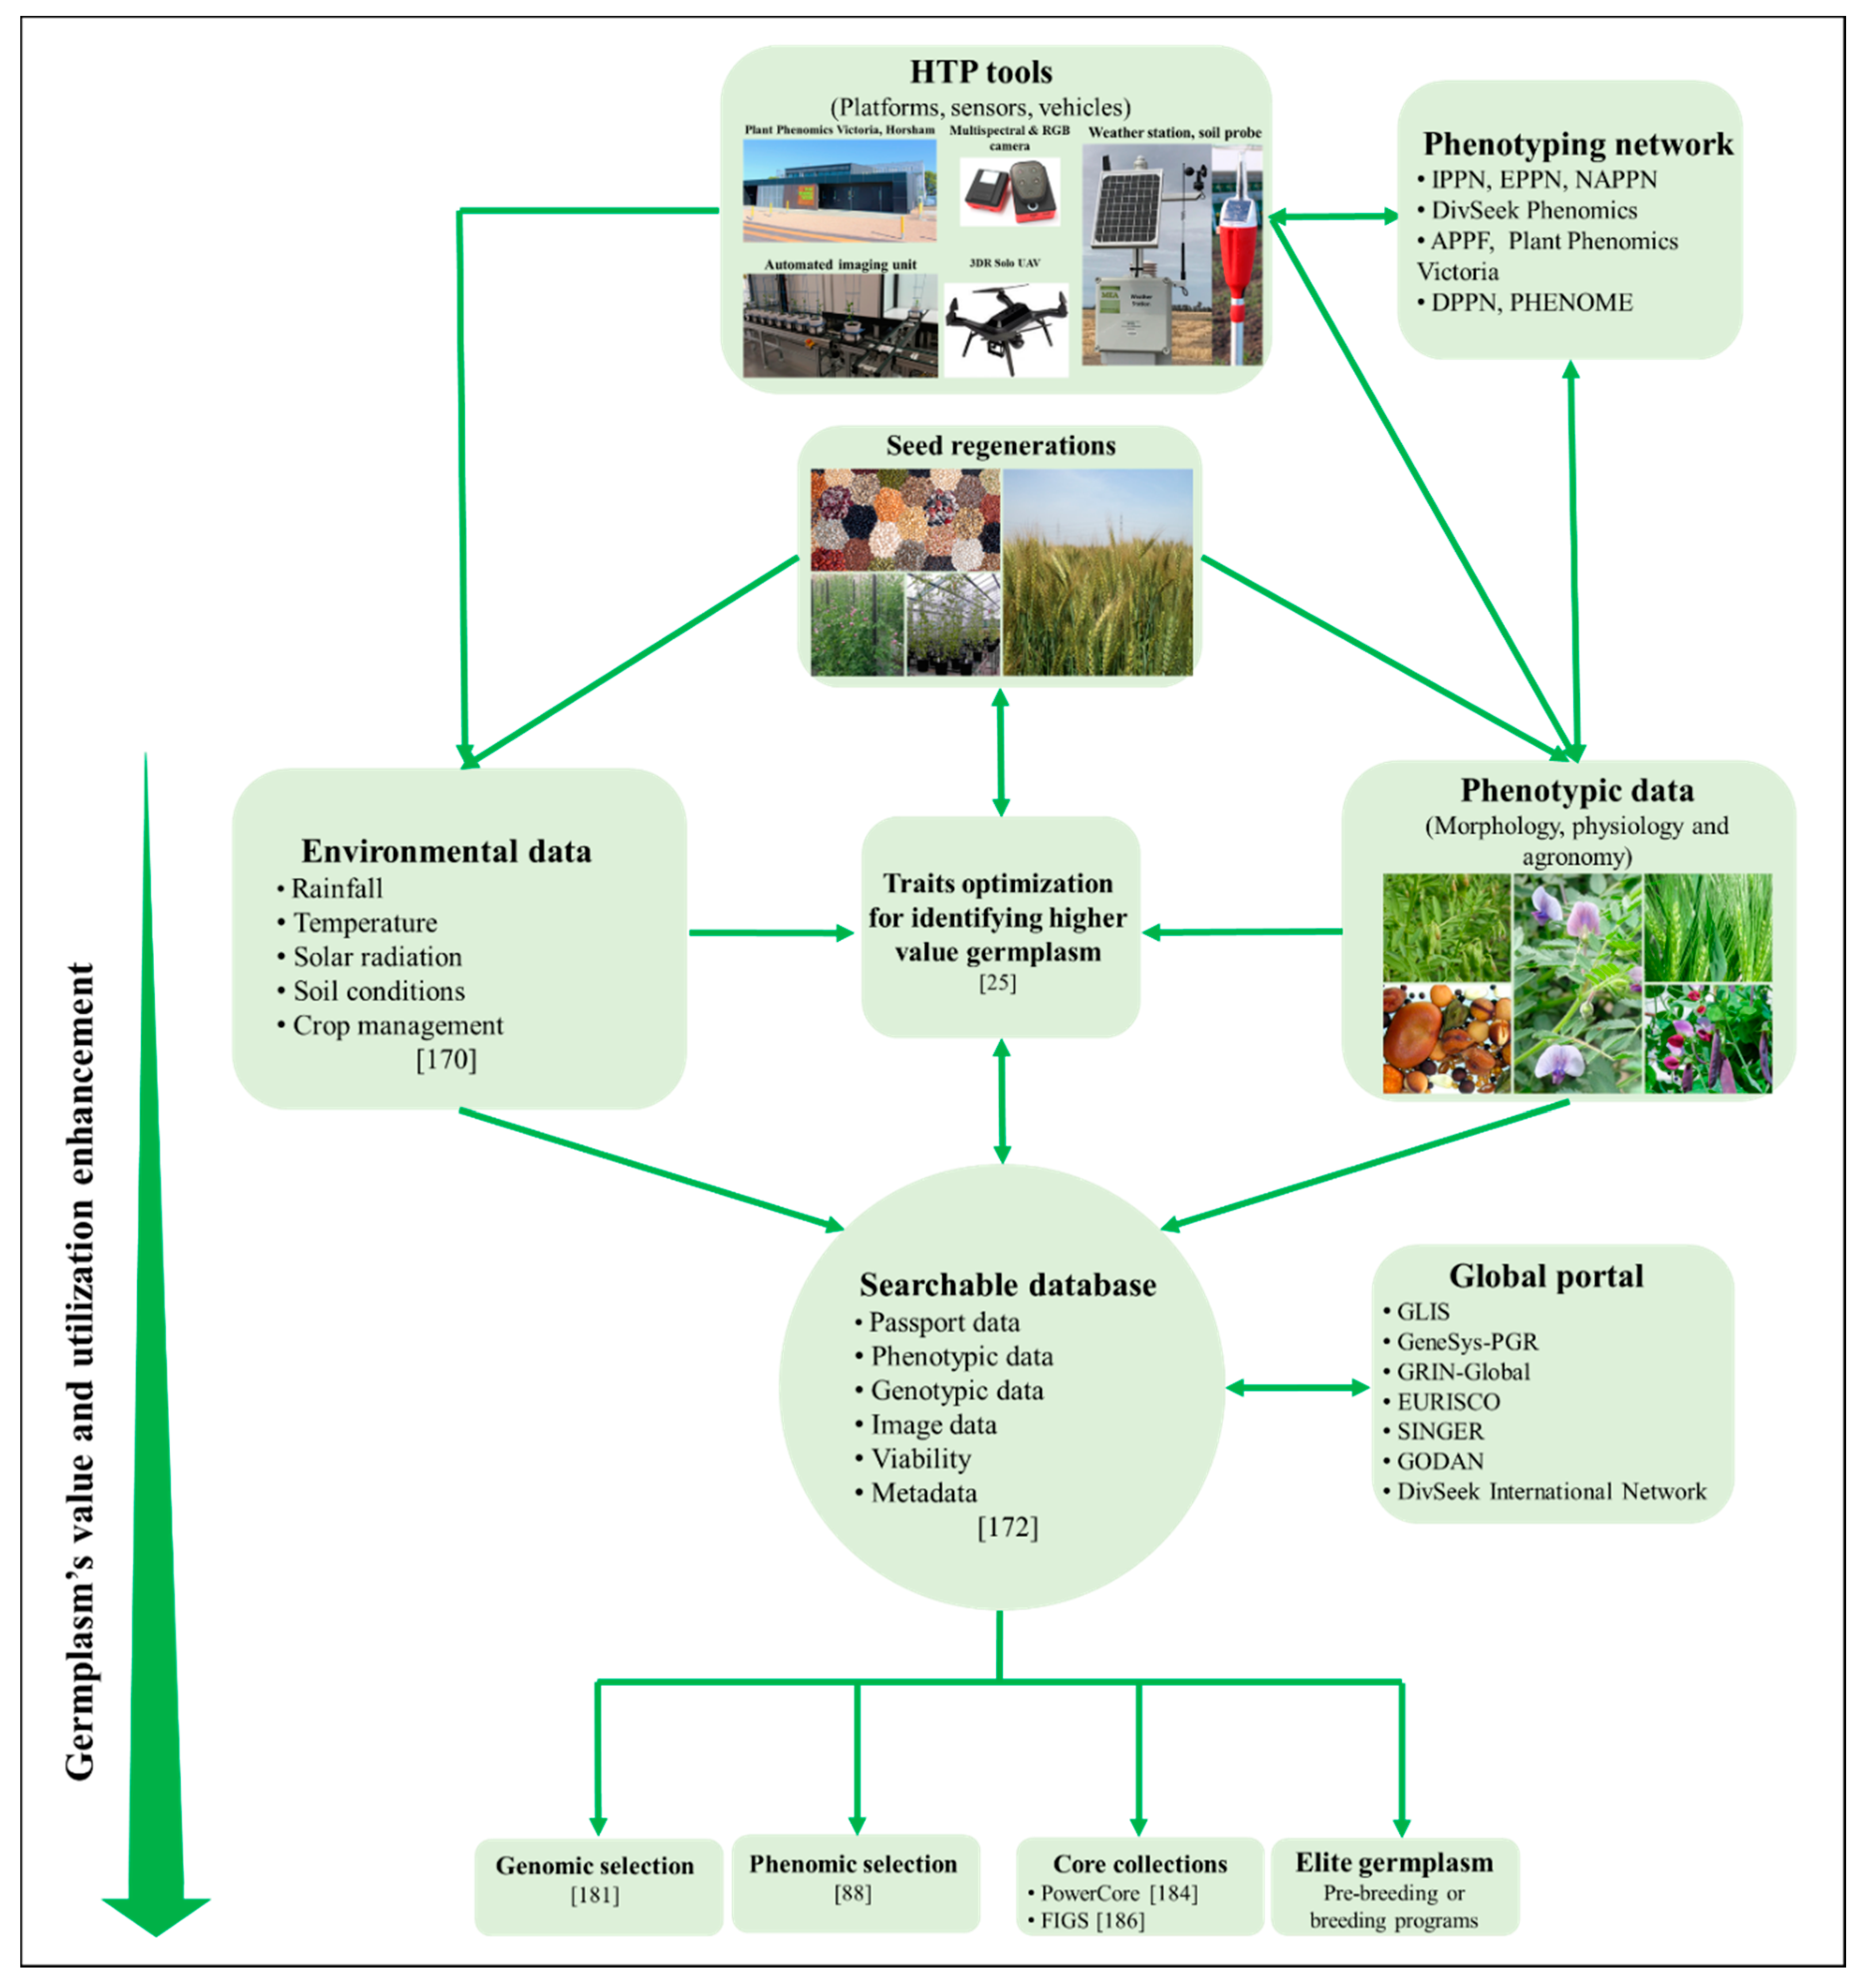
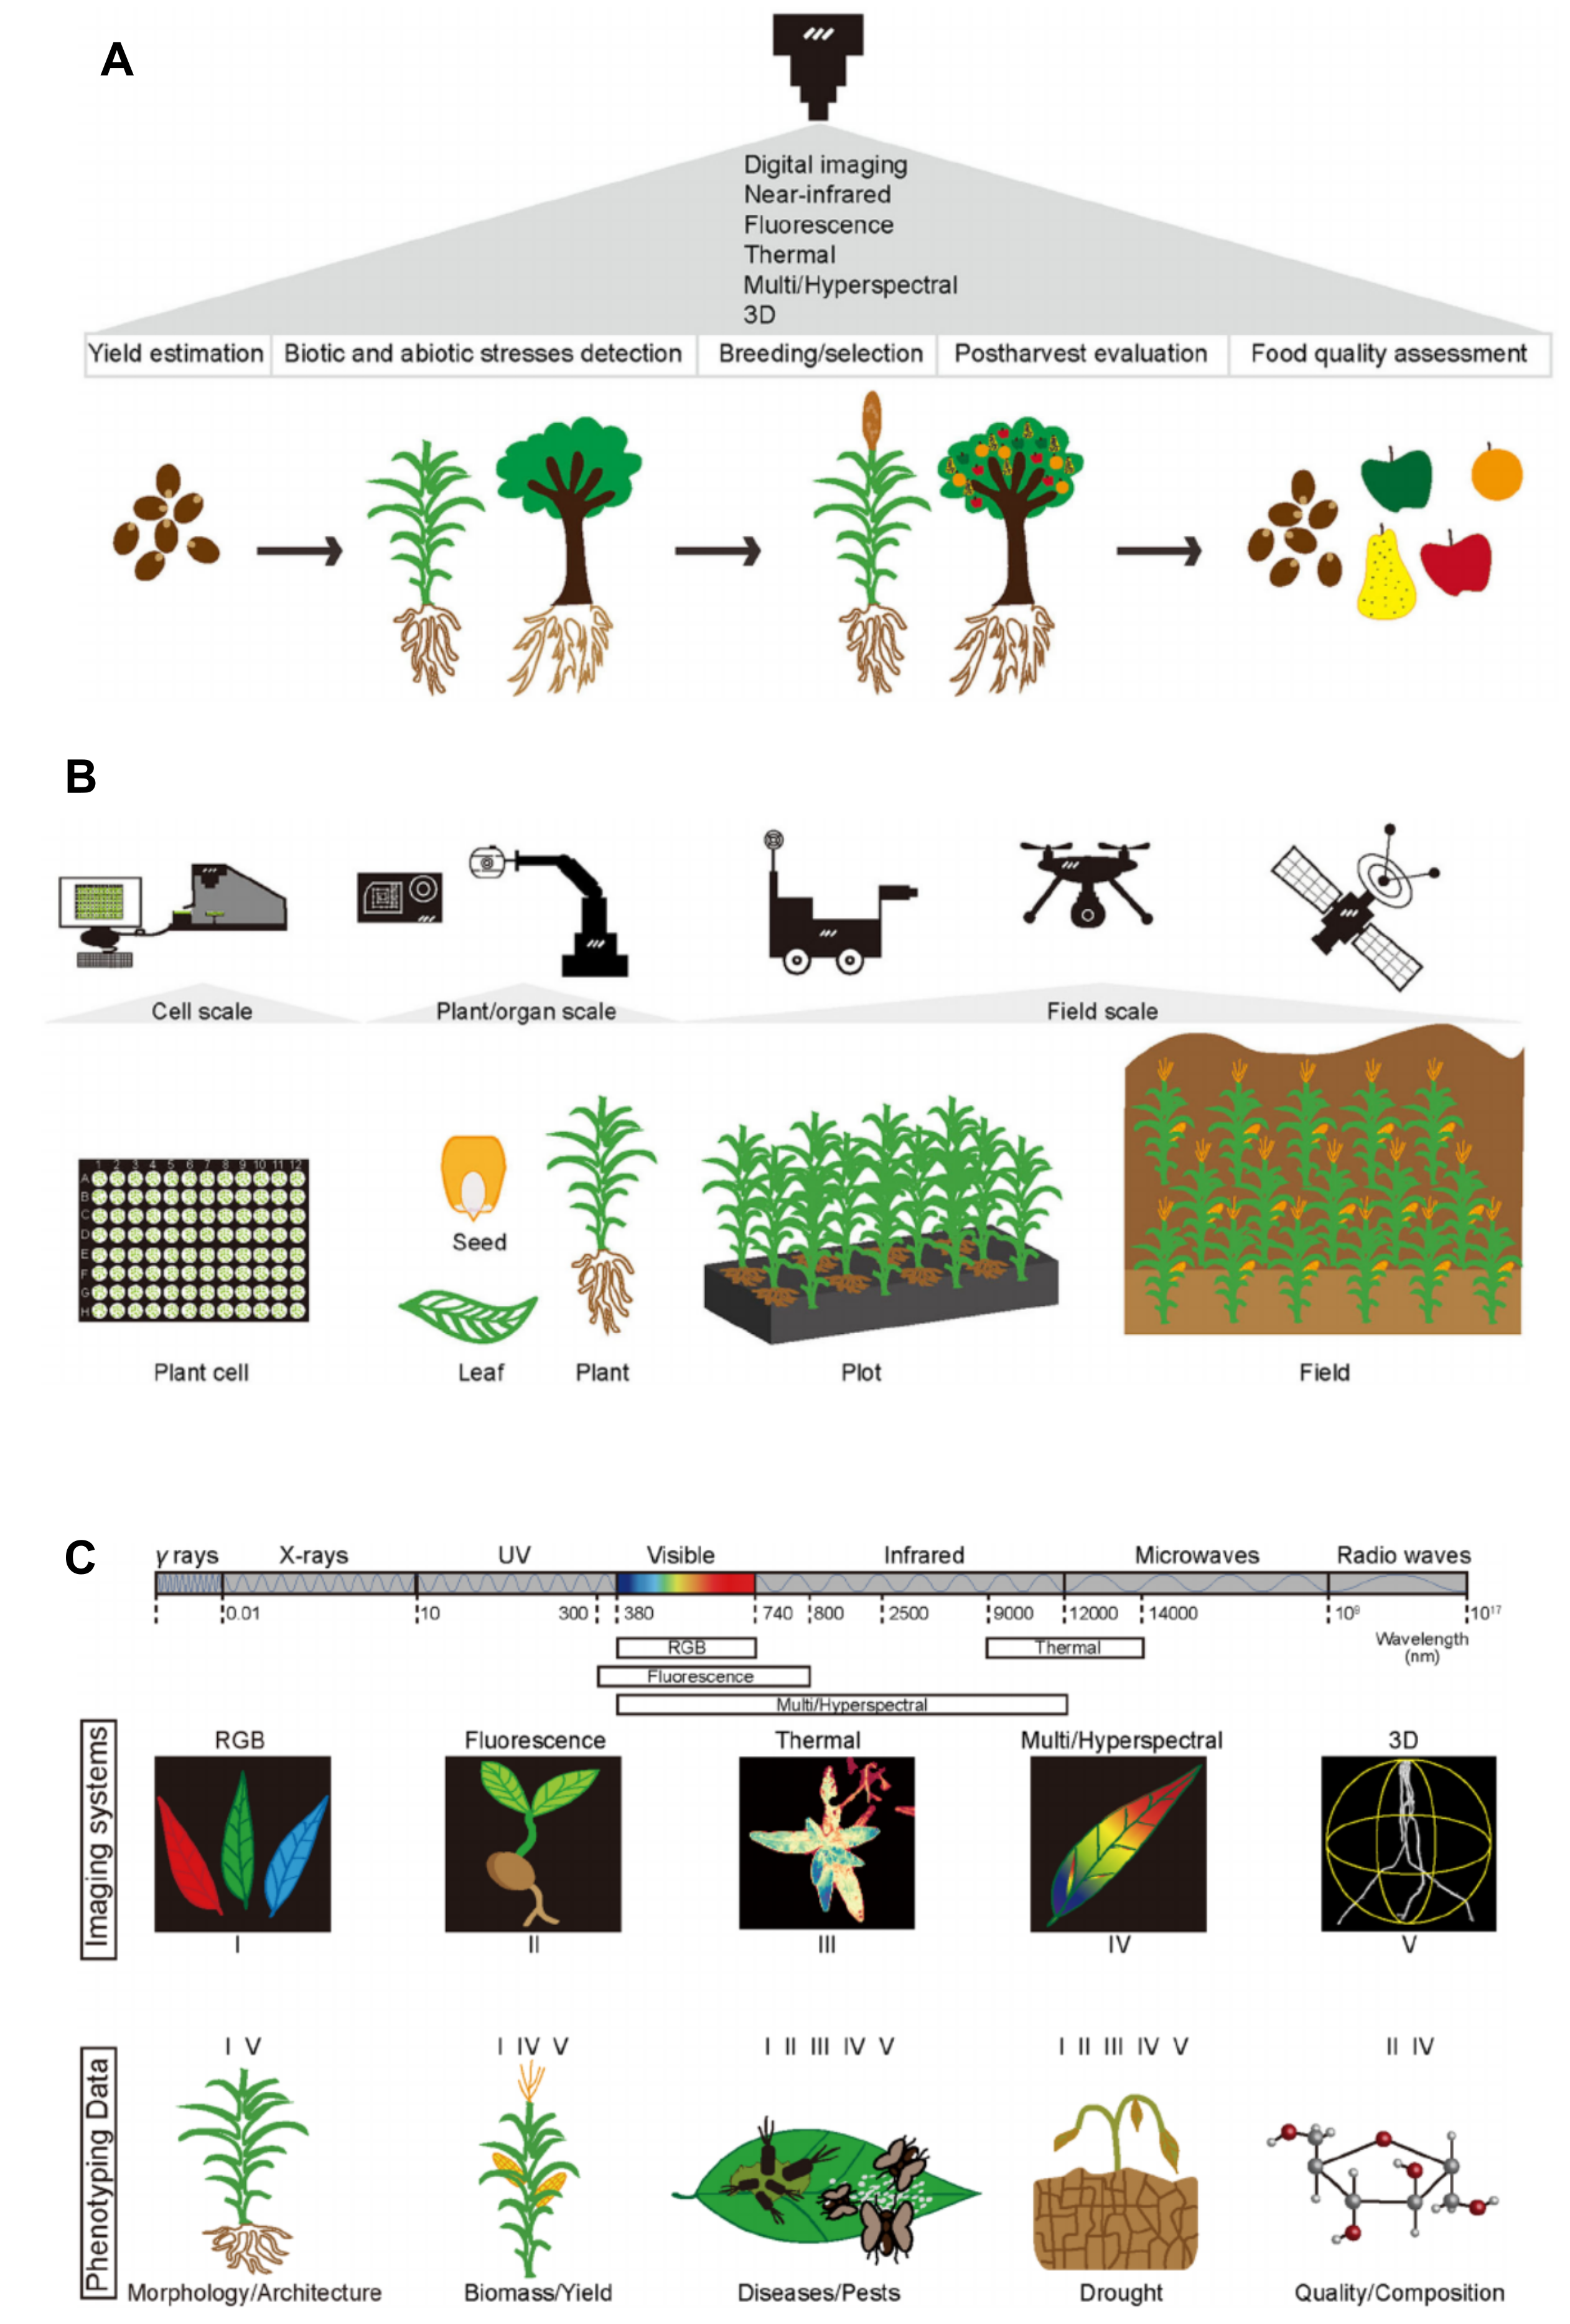
Figure 1 shows an integrated strategy to achieve a systematic phenotypic analysis of genetic resources that is based on state-of-the art phenotyping technologies, analysis methods and computational processing.
Strategies for the analysis of phenotypic variation of genetic resources
A key challenge in the characterization of PGR is that they are frequently adapted to certain environmental conditions that are required to express their "native" phenotype. For example, genotypes adapted to short days or cold environment may not express their correct phenotyped if cultivated under long-day or without cold vernalisation. Various strategies were developed to account for such genotype x environment interactions that interfere with a proper phenotypic evaluation.
Direct estimation of phenotypic variation
A simple approach is to cultivate diverse genetic resources in multiple locations with different environmental parameters and then estimate the extent of GxE variation for each genotype. Then, phenotypic clustering can be used (possibly in combination with genotypic clustering or information about the geographic clustering) to identify the optimal environment for phenotypic analysis of a trait in a given set of genotypes. For example, it the trait of interest is grain yield, it does not make sense to cultivate a genotype that is adapted to short days in a long-day environment because it may not reach maturity and therefore grain yield can not be determined.
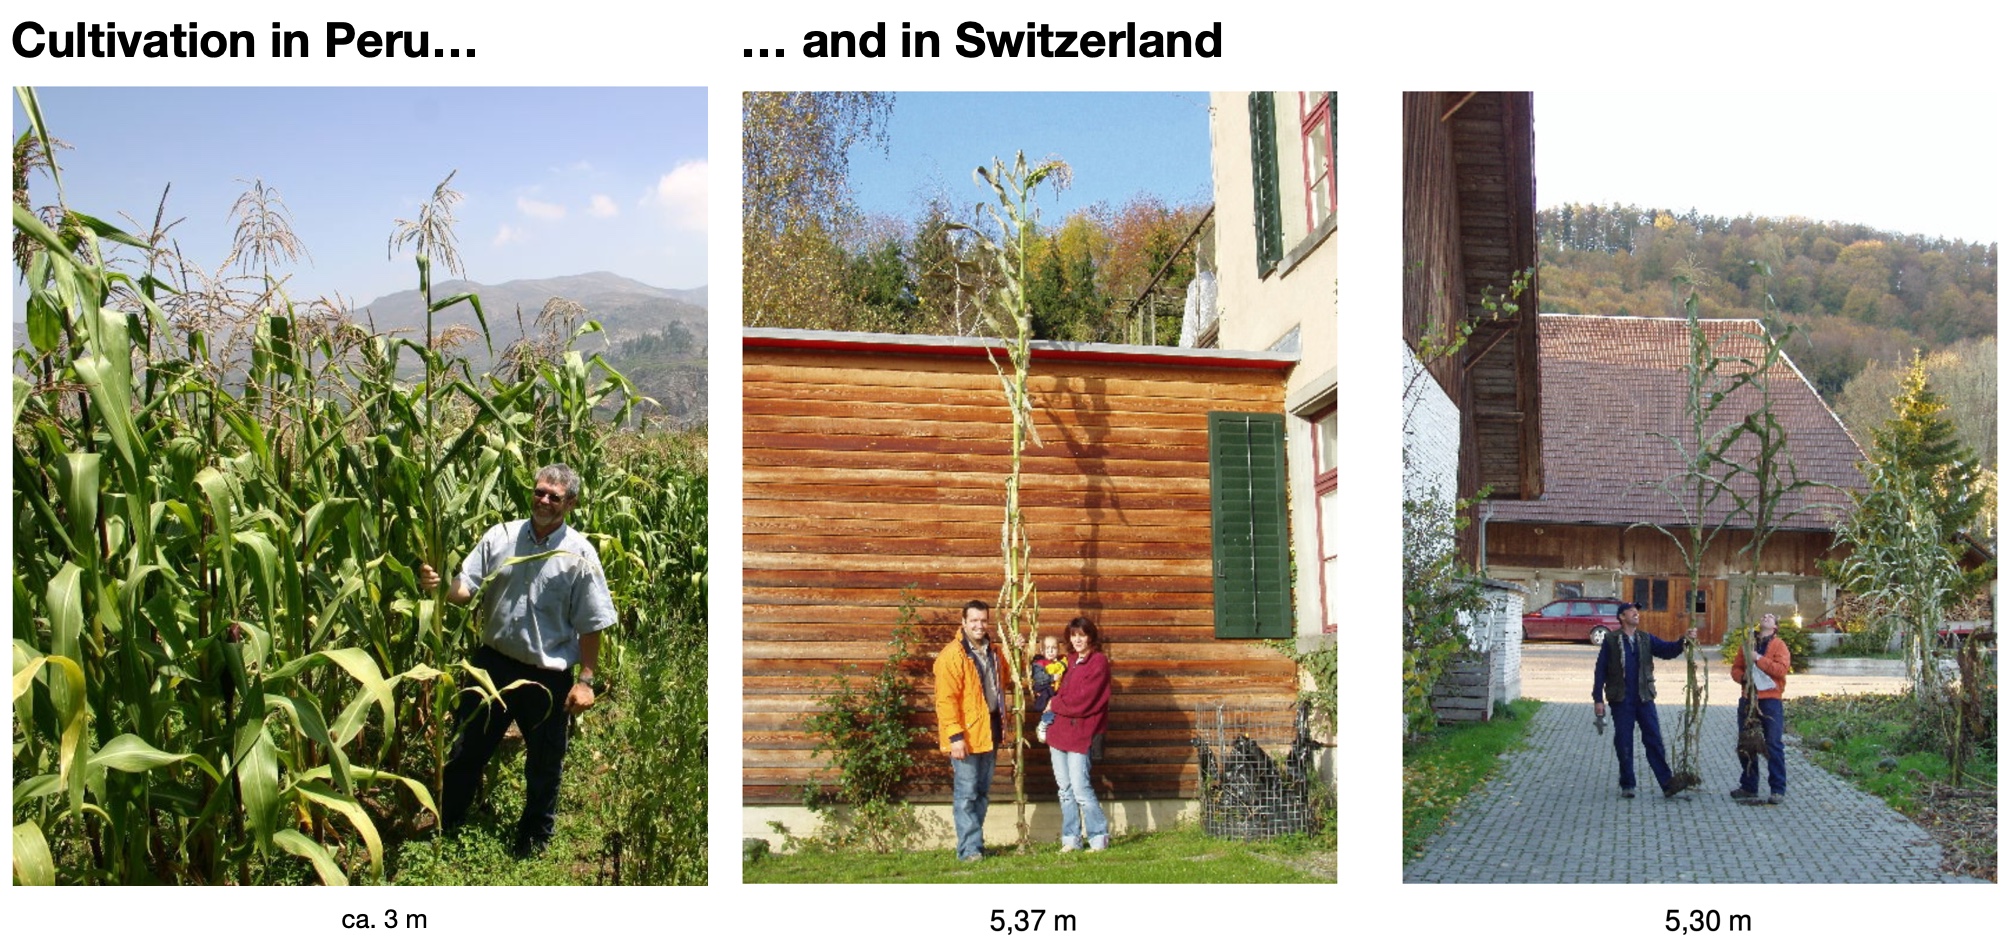
Figure 2 shows a maize elite hybrid variety created for cultivation in Central Europe. Since it is adapted to the European climate and photoperiod and was bred for biomass production (i.e., a large plant height due to a long vegetative growth phase and late flowering), it is very large, whereas in Peru in a short day environment, the flowering time is much earlier and plant height is reduced.
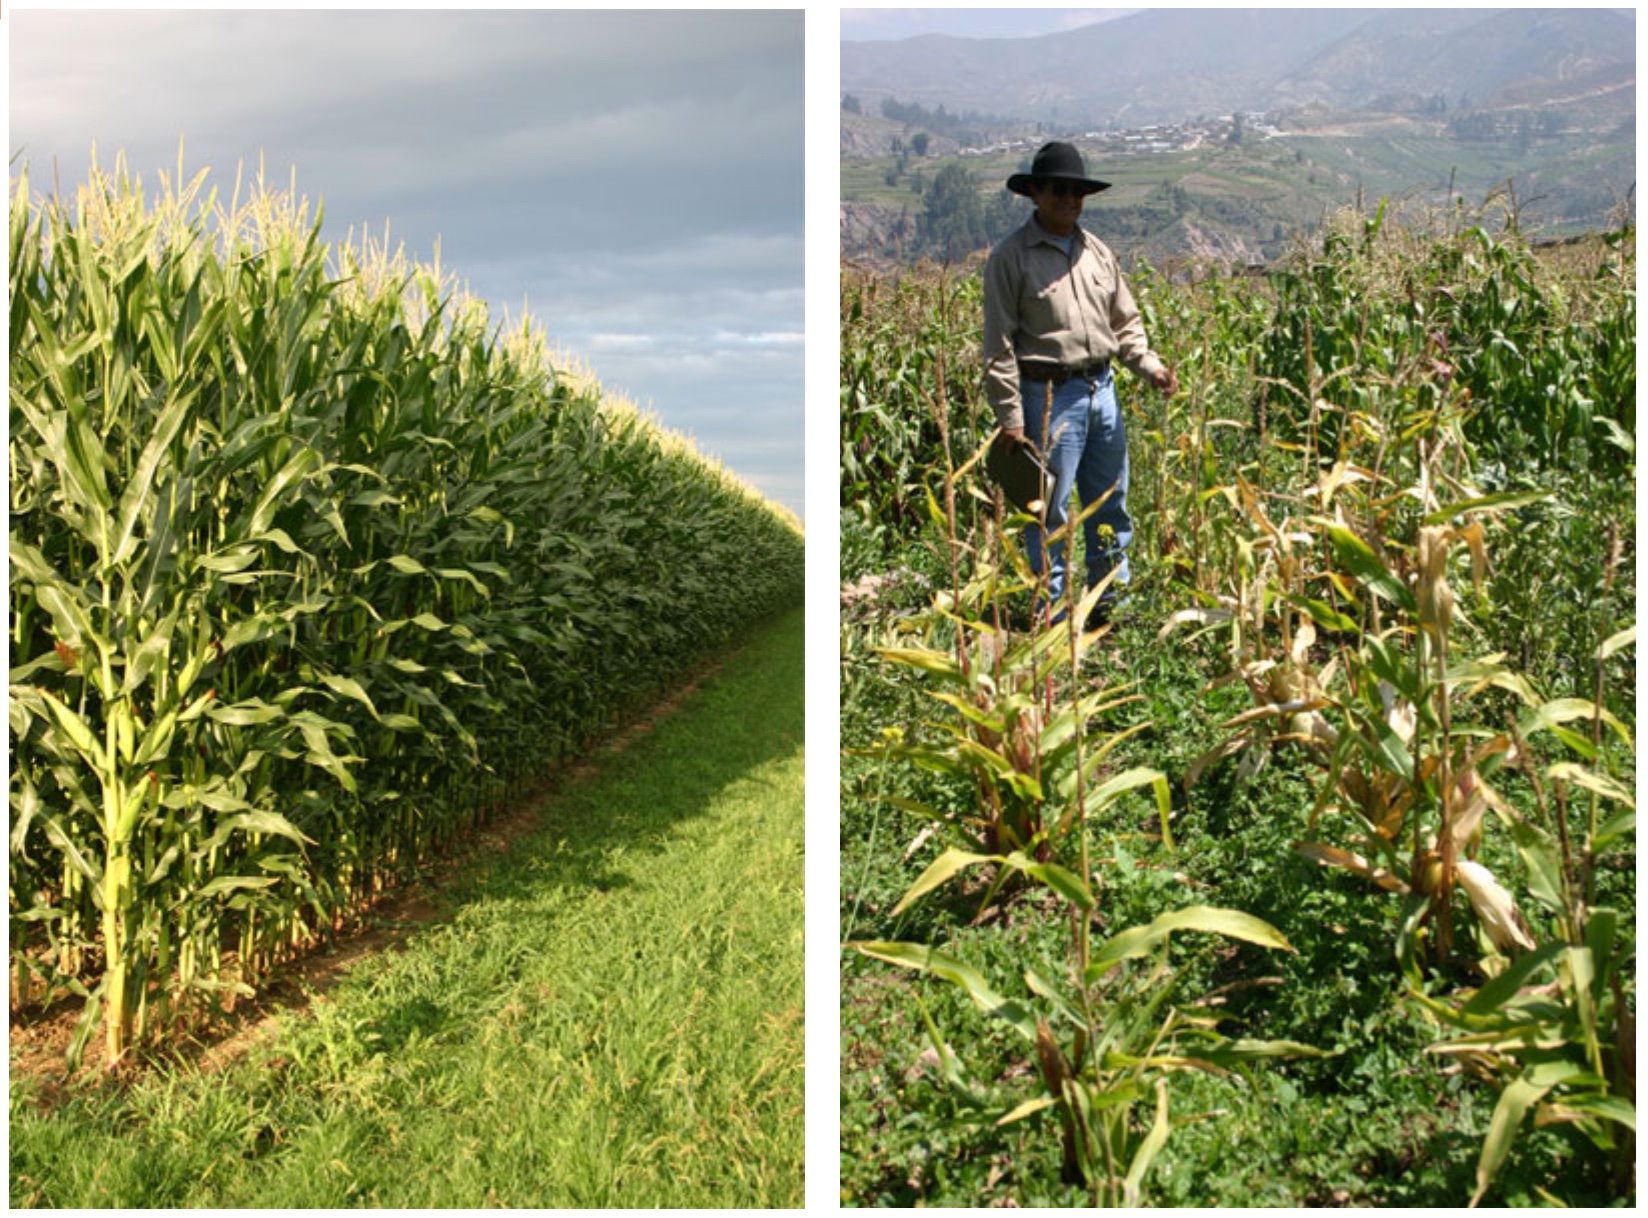
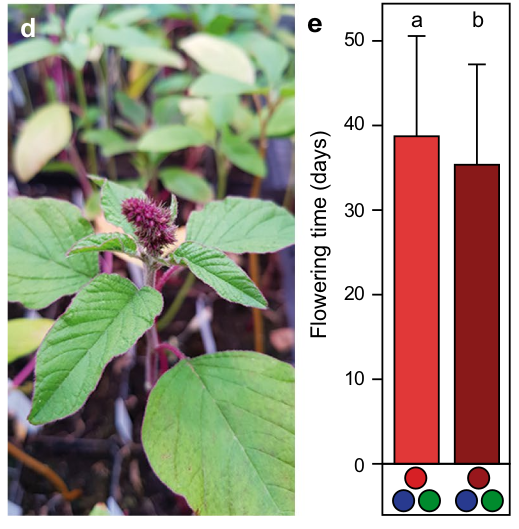
The opposite effect is observed with a Peruvian landrace that is cultivated in Europe (Figure 3). In their native cultivation environment under short-day conditions, plant height is normal with a height of about 3 m, whereas under the the long-day conditions of Central Europe, its height is more than 5 m and due to a very late flowering, the maize cobs may not be fully developed at the end of the growing season.
Since flowering time and grain yield are strongly correlated in maize, for example, these examples show that the cultivation environment plays an important role in the evaluation of plant genetic resources.
Crosses with a common tester
One approach to mitigate the effects of allelic diversity in plant genetic resources is to cross exotic and potentially nonadapted genetic resources with a tester and therefore buffer or reduce the strong effects of an exotic background for the evaluation of phenotypic variation.
The advantage is that allelic effects of PGR can be evaluated in a common genetic background. A disadvantage of this approach is that F1 lines resulting from such a cross are highly heterozygous and therefore further work (i.e., self-fertilizations) are needed to identify genes of interest and to make them genetically s(i.e., for seed production and evaluation in more environments), because any offspring populations are segregating for the trait.
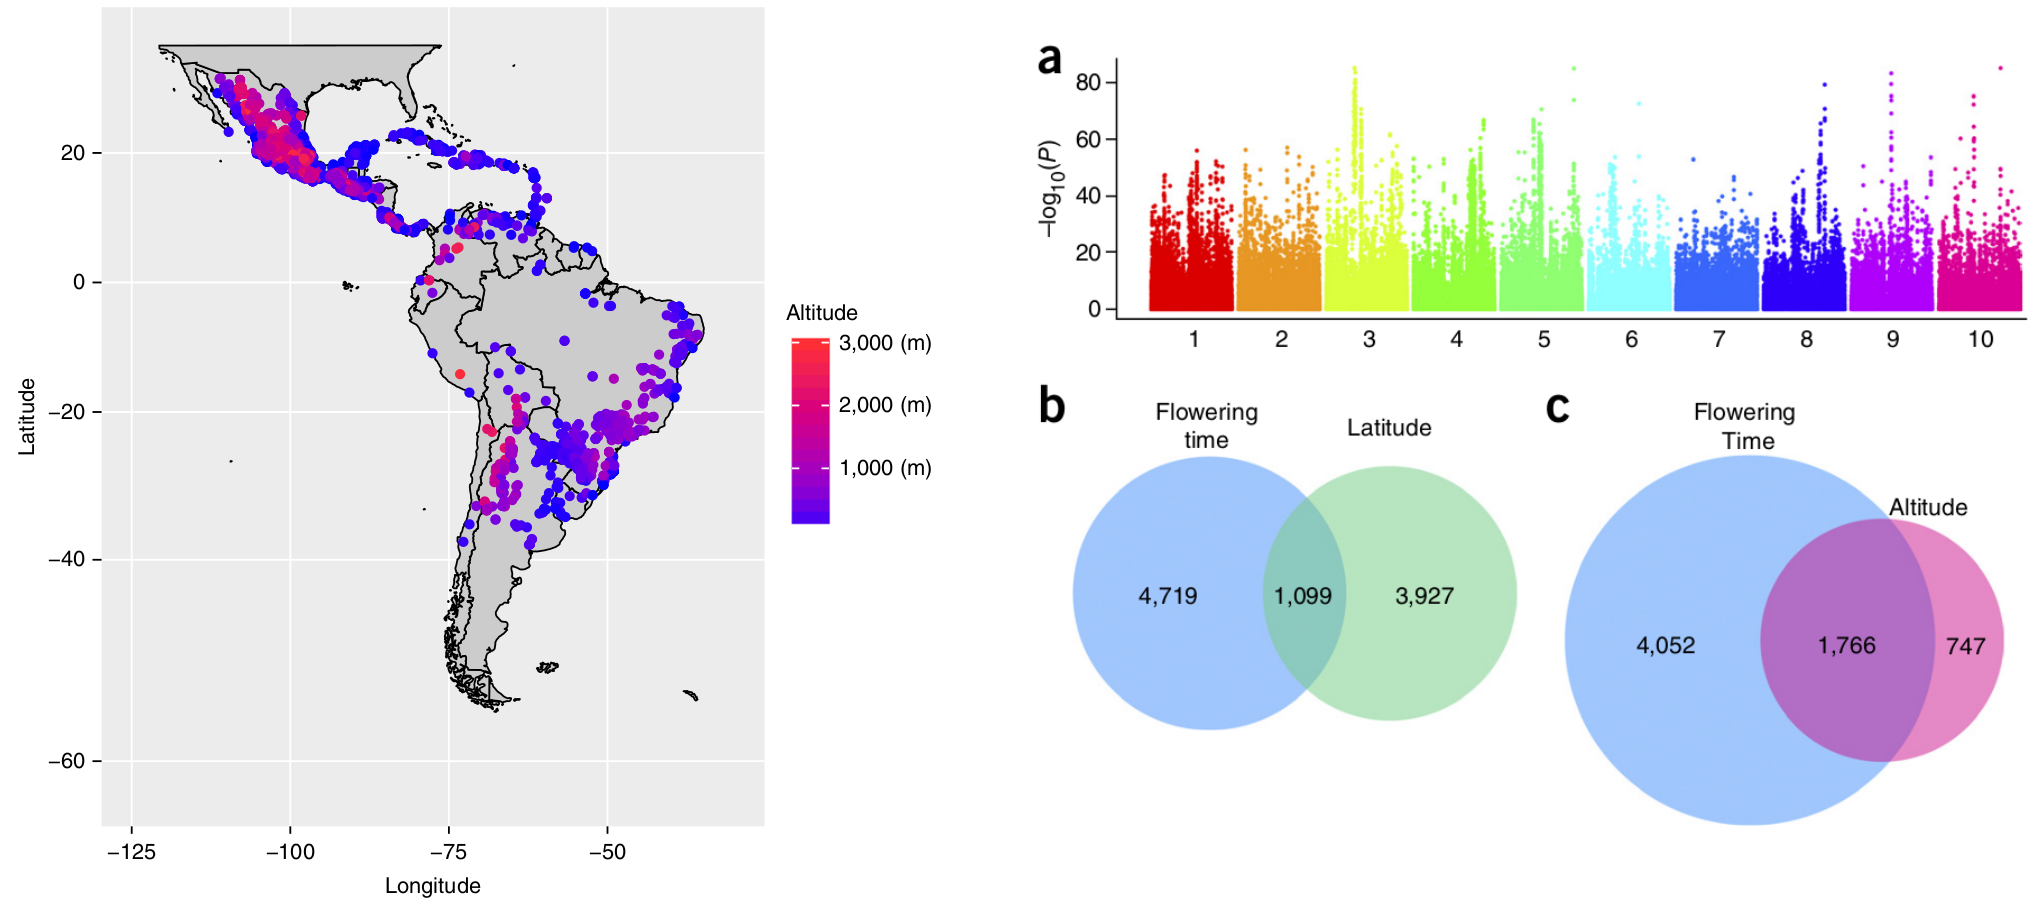
This F1 approach was taken by Romero Navarro et al. (2017) who crossed one individual each of 4,471 maize landrace populations originating from Central and South America with a single tester and then evaluated the resulting F1 offspring at multiple location. All landraces were also genotyped. A genome-wide association study revealed multiple genes controlling flowering time. There was a strong overlap of SNP polymorphisms which are associated with flowering time and SNPs that are associated with altitude at the site of origin of a landrace and with the latitude of the origin of the landrace, respectively. This is a strong indication of local adaptation of maize landraces and explains the strong GxE effects demonstrated in the previous section.
DH lines and crosses with a tester
The management and analysis of phenotypic variation differs between self-fertilizing and outcrossing species. In self-fertilized species, the level of homozygosity is usually high and variation within populations limited, although this may not be the case in species with some outcrossing. For example, although amaranth and quinoa are mainly self-fertilizing, outcrossing rates of 1% to 20% have been observed, which allows to maintain substantial heterozygosity in a population. However, by multiple generations of self-fertilization genetically slines with little inbreeding depression can be generated and analysed. In contrast, outcrossing species are frequently self-incompatible or show substantial inbreeding depression, which can be expected to be high in genetic resources such as landraces. For this reason, it has been proposed to create Doubled Haploid (DH) lines directly from exotic genetic material and use this for both the conservation of genetic diversity and their phenotypic evaluation. DH lines have the advantage that they can be easily propagated and therefore maintained stably and also crossed with different testers to evaluate there genetic values in different backgrounds.
This approach was demonstrated for seven European maize landraces in a series of studies. First, DH lines were created from various landraces by crossing them with an inductor to create haploid plants whose genomes were subsequently doubled using colchicine treatment (Melchinger et al., 2017). A comparison of the success rate of DH production between landraces and commercial hybrids shows the effect of the genetic load, because the overall success rate (OSR) was on average more than two times higher with the elite crosses than with the landraces (Table 1) and statistically significant (\(P<0.01\))
| Source Germplasm | NS | ND1 | OSR |
|---|---|---|---|
| Landraces (LR) | |||
| Gelber Badischer(GB) | 113,596 | 59 | 3.76 |
| Rheinthaler (RT) | 44,557 | 43 | 4.75 |
| Strenzfelder (SF) | 41,779 | 61 | 4.83 |
| Satu Mare (SM) | 114,712 | 108 | 4.52 |
| Walliser (WA) | 68,356 | 117 | 4.99 |
| Sum/mean | 383,000 | 388 | 4.57 |
| Elite crosses (EC) | 35,327 | 137 | 11.55 |
Since the genetic load of the landraces is expected to be high, there may be a strong selection against recessive deleterious variation and therefore a low success rate in the production of DH lines as well as a loss of genetic variation in the population of DH lines compared to the the original landrace population. The lower success rate in DH production was confirmed, but not the loss of genetic diversity.
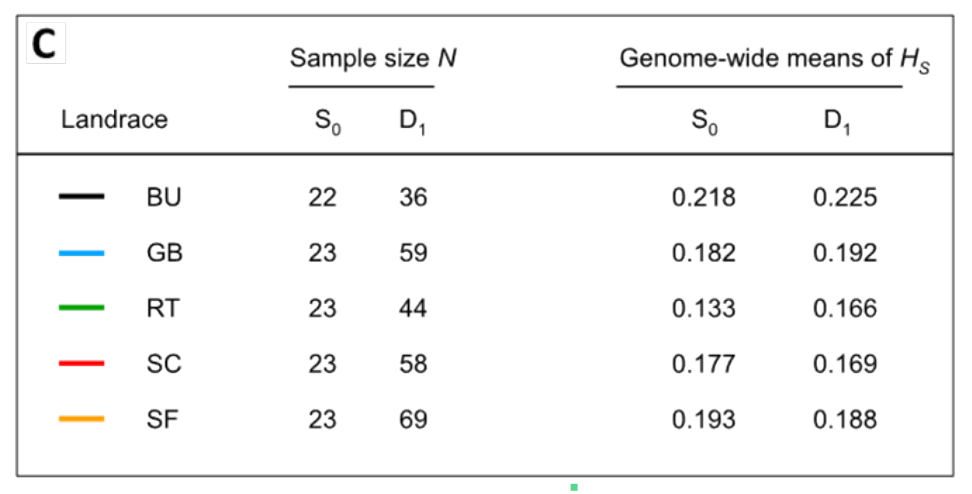
Five of the seven landraces were genotyped with 28,133 SNP markers and Nei's gene diversity as measure of genetic diversity was calculated. A comparison between the original landraces and the DH lines show that there is no decrease in this measure of diversity (i.e., the expected proportion of heterozygotes under HWE) suggesting that DH lines harbor the same amount of genetic variation than the original outcrossed genotypes of the landraces (Table 2).
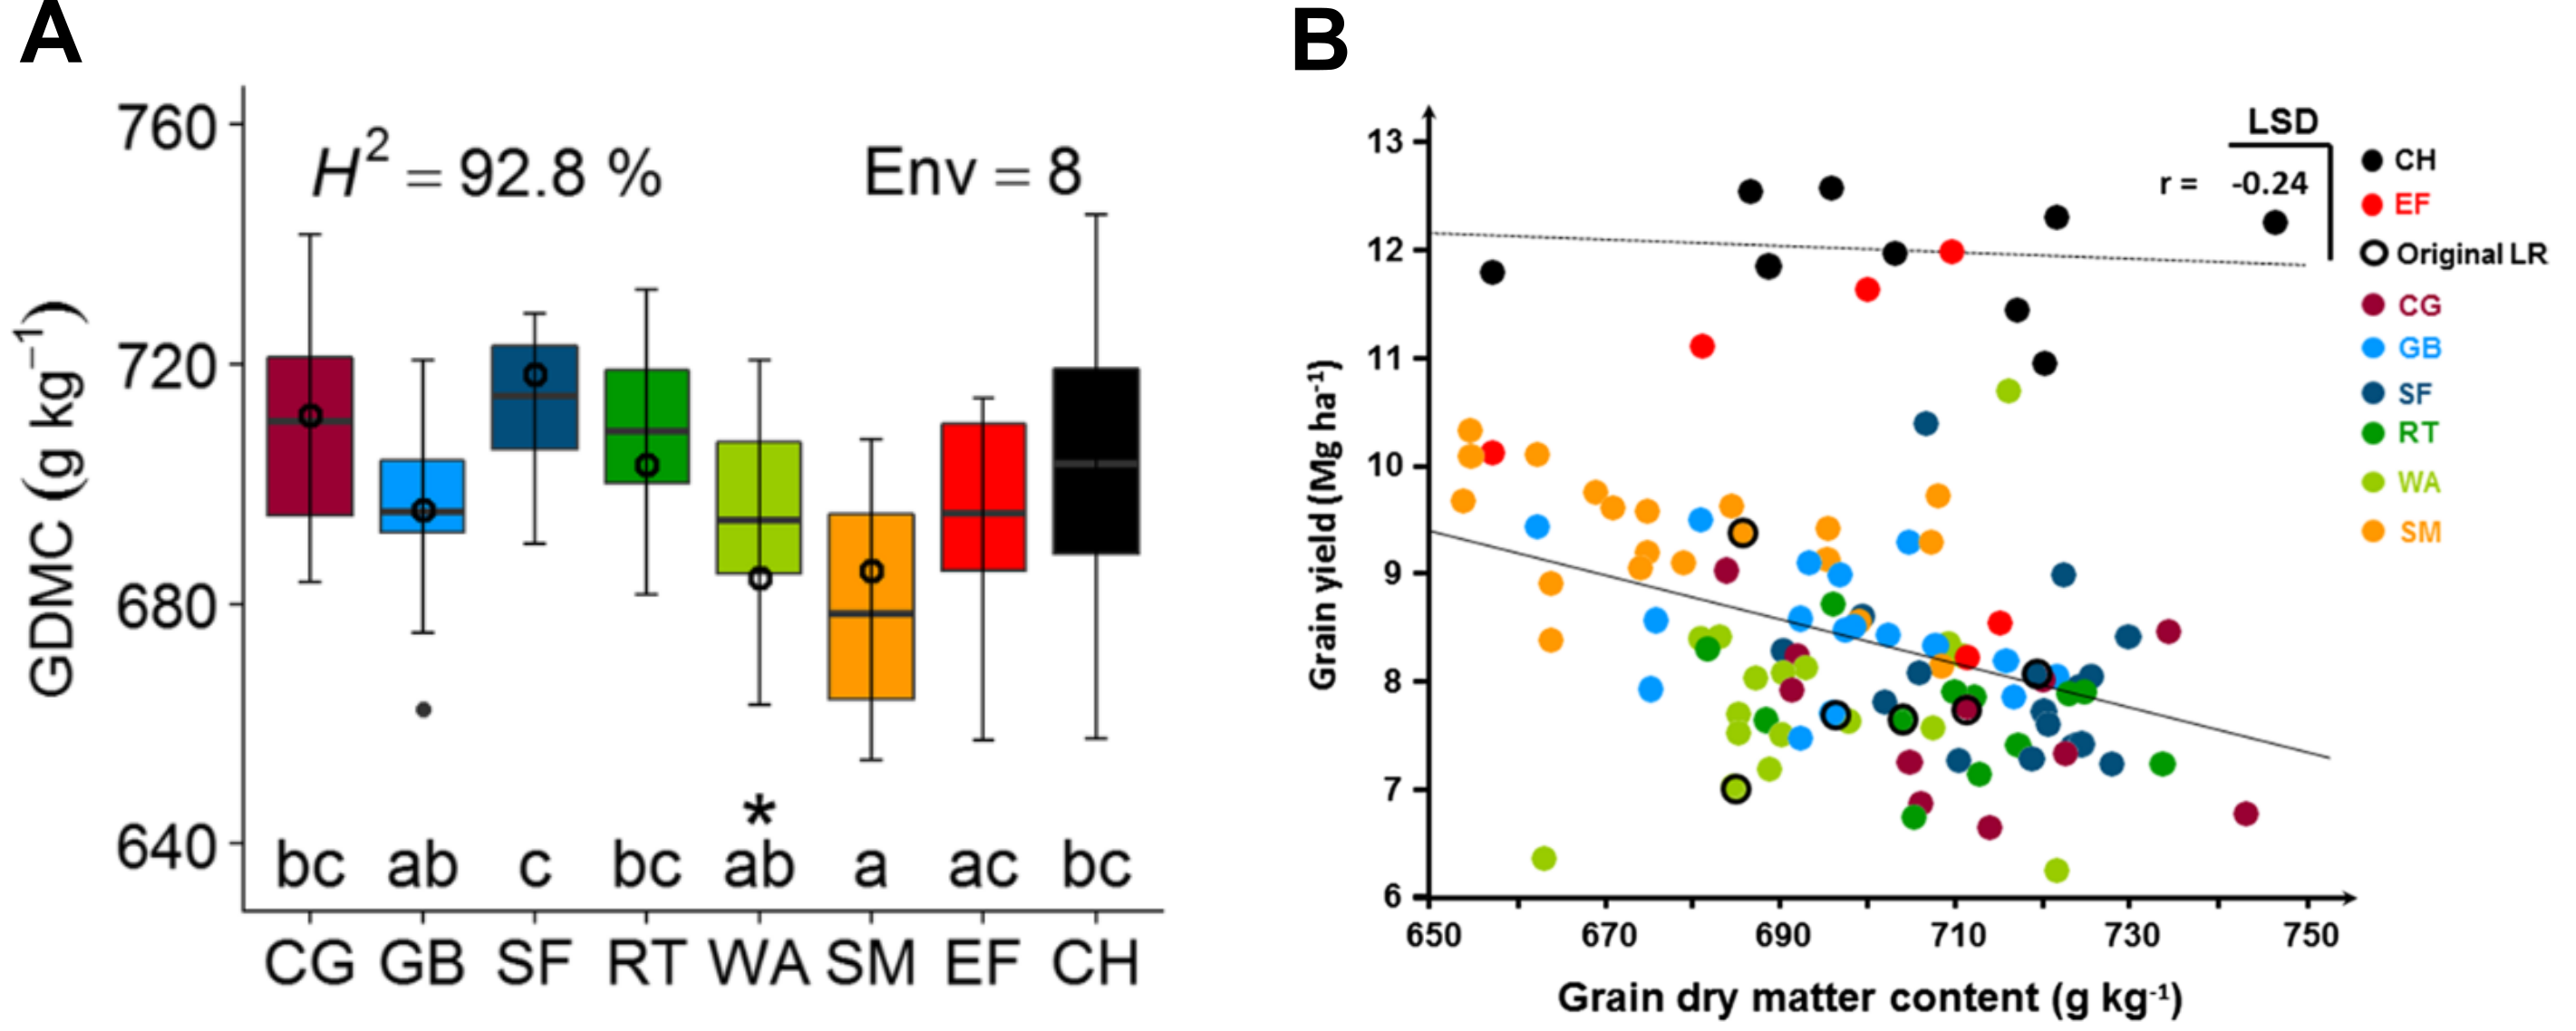
Then, these DH lines were crossed with testers and evaluated in different environments (Brauner et al., 2019). The results for the trait 'grain dry matter yield', which were evaluated in eight environments are shown in Figure 5. The phenotypic variation of the landrace populations is comparable to the commercial hybrids. A correlation of grain dry matter yield with total yield shows that the DH lines tend to show a higher level of variation than original (heterozygous) genotypes of the landraces. The correlation also shows that the total average dry matter yield of the commercial hybrids is vastly superior over the hybrids created from the DH lines, although individual lines from the EF line appear to have high grain yield.
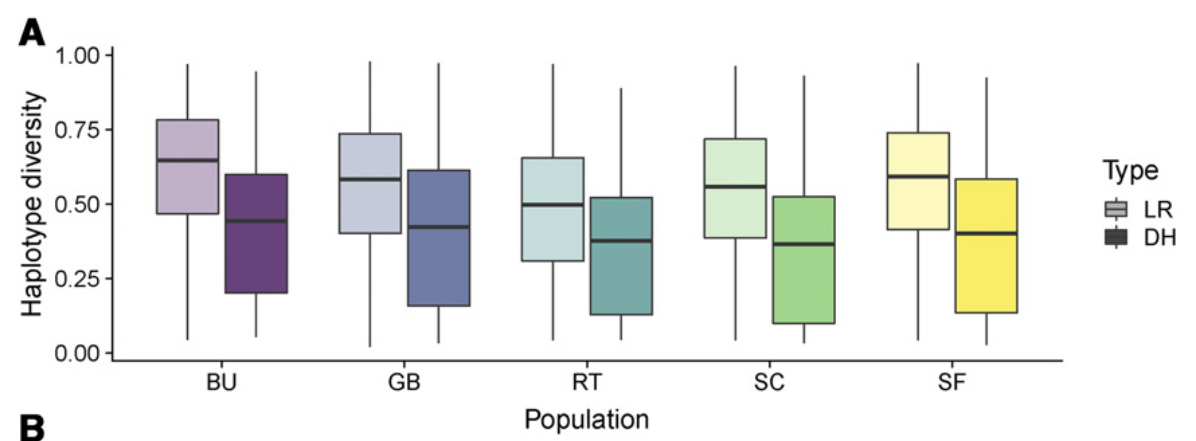
However, a re-analysis of the genetic diversity revealed that in particular rare alleles are lost in the DH lines in comparison to the original landrace as indicated by a lower haplotype diversity in the DH lines than in the original landrace (Figure 6). This suggests that DH lines are only suias stores of native genetic diversity if large numbers of DH can be produced that capture a large number of rare alleles.
Multiparent mapping populations for evaluating PGR
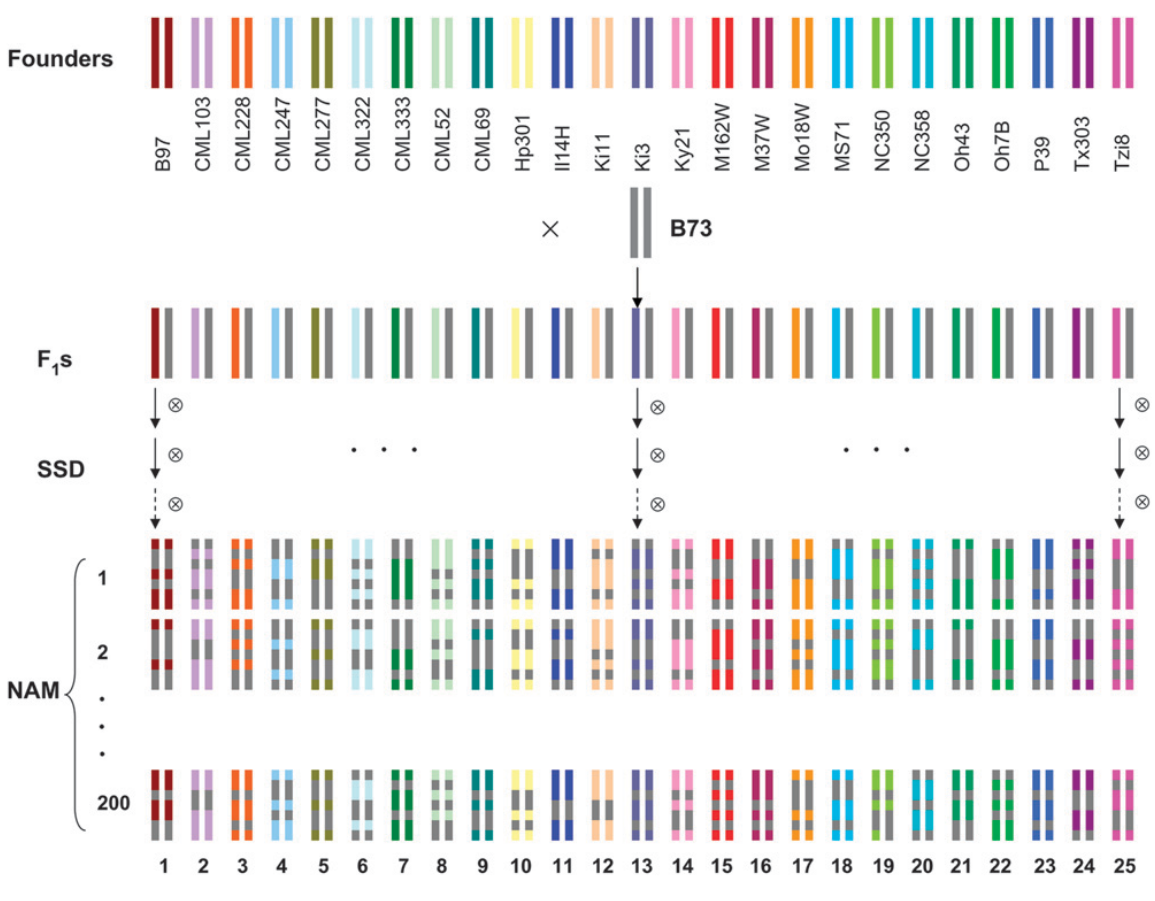
A more advanced version of the \(F_1\) based approach described above is to cross exotic genetic resources with either a single or a few advanced or elite tester lines and then to create recombinant inbred lines by repeated generations of self fertilizations or by creating doubled haploid lines from the \(F_1\) generation of such crosses. One such design is the nested association mapping (NAM) panel which was first described by Yu et al. (2008) and whose mating scheme is shown in Figure 7
A main disadvantage of this design is that the number of exotic parents that can be crossed and evaluated is limited (usually to tens of genotypes) because a large number of offspring (i.e., resulting lines) need to be maintained and evaluated in order to characterize the genetic and phenotypic diversity segregating among the offspring. For this reason, NAM and related mating designs such as multiparent advanced generation intercross populations (MAGIC) are more suifor the precision mapping of genes based on phenotypic evaluation and subsequent introgression into elite material rather than a large scale evaluation of plant genetic resources, i.e., from gene banks (Figure 8). Since such lines are genetically stable (“immortal”), they need to be genotyped only once, but can be distributed to many researchers and evaluated in multiple environments and for multiple traits. Furthermore, since such designs include more than two parents the overall level of genetic diversity is rather high and they can be evaluated for multiple traits. For this reason, NAM and MAGIC designs were created for many crops including maize, wheat, barley, soybean, rice Gage et al. (2020; Gireesh et al., 2021). For an example of identifying candidate genes for salinity tolerance in wild barley NAM, see Saade et al. (2016).
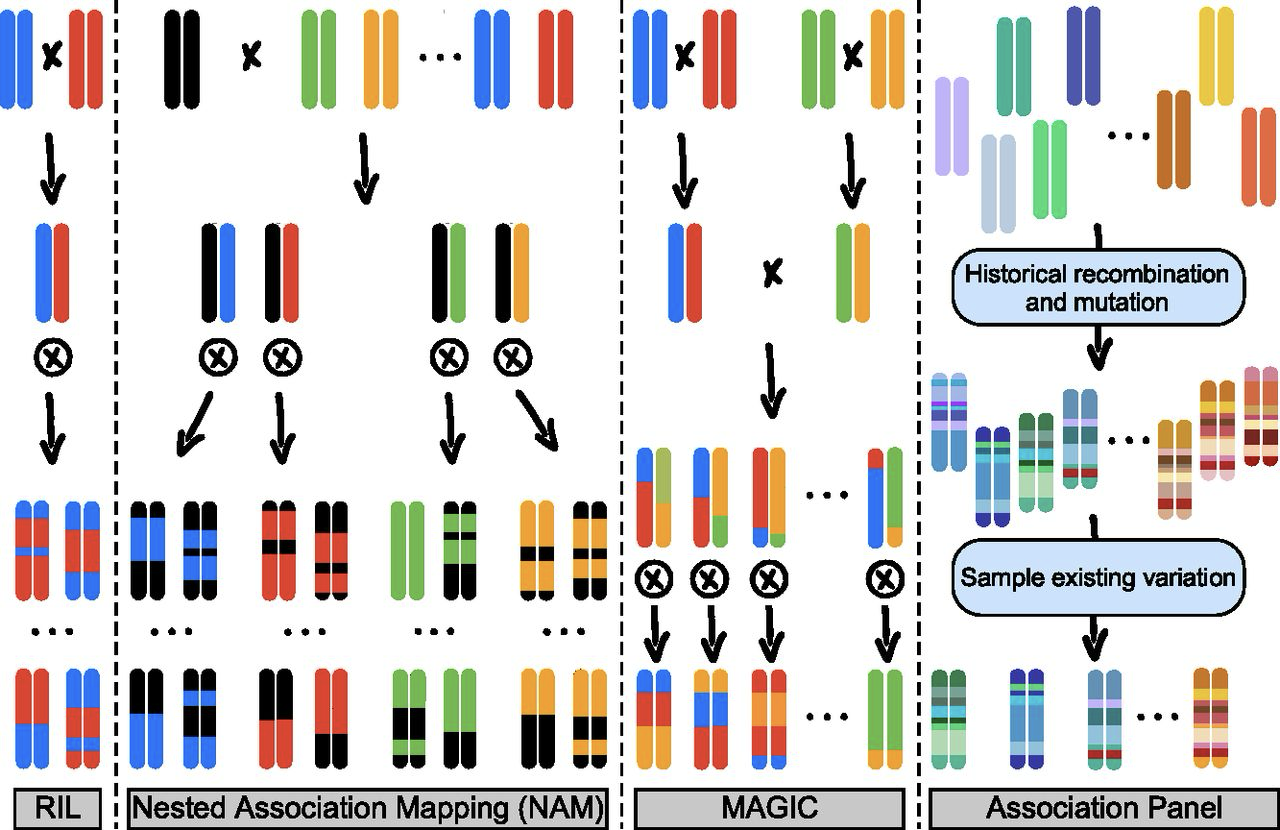
Generally, using NAM or MAGIC crossing schemes dynamic gene pools as were presented in the context of in situ conservation can be created.
Analysis of phenotypic variation in the field versus controlled environments
The characterization of phenotypic variation requires to take a decision where and how to cultivate plant genetic resources to achieve the desired objectives. On first glance such a decision may appear easy, but one may argue that many aspects need to be taken into account. These aspects are resources required and available (e.g., field sites, greenhouse space, growth chambers), genotype x environment interactions of traits investigated or phenotyping equipment required. Traits with a low GxE interaction can be phenotyped independent of the environment, other traits such as root traits may require specific equipment and set ups that can not achieved in a field trial but are available in a greenhouse settings.
In particular the decision of whether to characterize phenotypic variation in the field versus a controlled environment such as greenhouses or growth chambers is important.
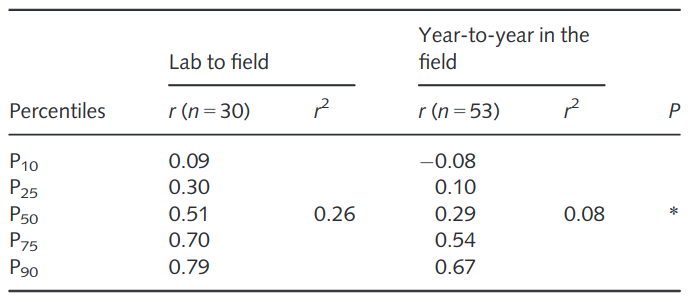
A comparison of phenotyping studies for the same trait in controlled versus field environments revealed that the correlation of trait values is rather low and highly variable between traits. Both types of environments differ in many variables that can have nonlinear and interaction effects. A very comprehensive meta-analysis found that the correlation of phenotypic values between the field and the lab (controlled environment) was only \(r^2=0.26\) (Poorter et al., 2016a). This result shows that phenotypic evaluation in controlled environments should consider whether or not it is necessary to simulate conditions in the field as closely as necessary for certain types of traits, in particular those with a high GxE interaction. However, one also needs to account for variation in the field, e.g., year to year variation in the same field, which has profound effects of phenotypic evaluation. A meta analysis showed that such a correlation is even lower than a comparison from lab to field (Table 3).
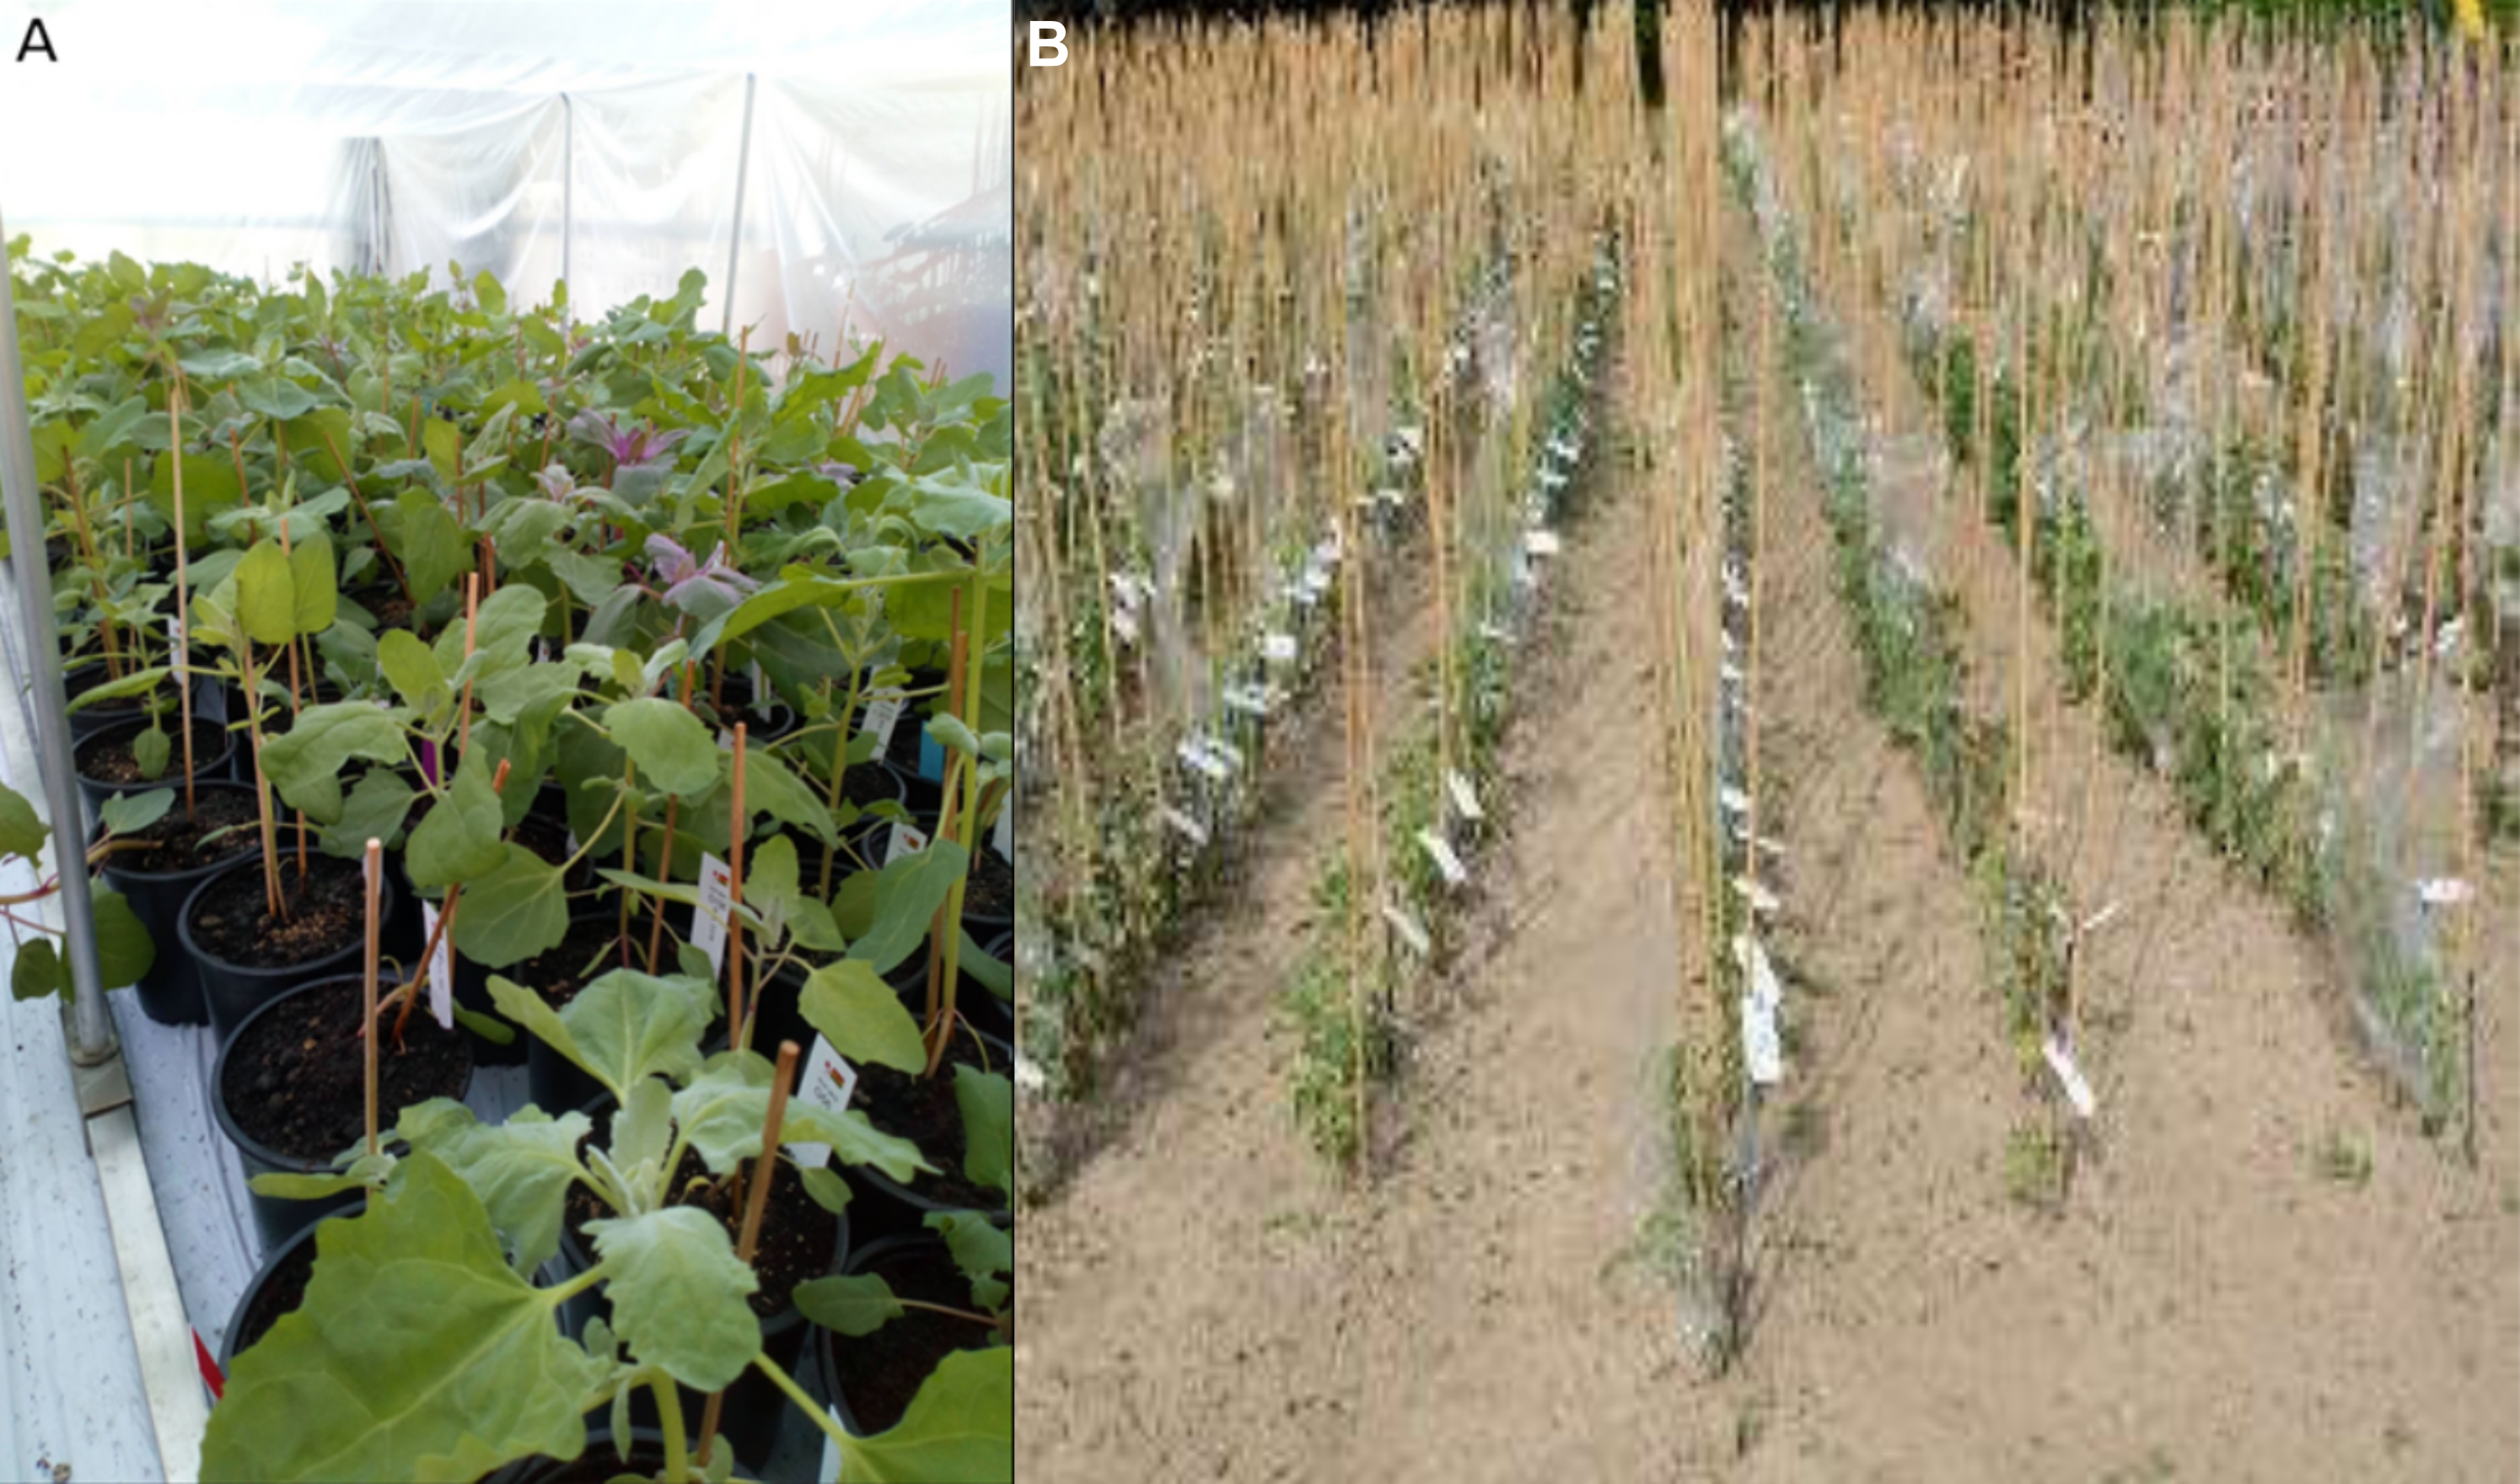
An example of the discrepancies is evident in the analysis of mildew tolerance in quinoa, Chenopodium quinoa. One study investigated mildew tolerance in a field experiment with 310 genebank accessions representing quinoa diversity where infection was natural with unknown pathotypes (Patiranage et al., 2020). A second study was based on greenhouse experiments in which a smaller number of different genebank accessions was inoculated with a single, well defined isolate of mildew and the susceptibility was scored with different means (Colque-Little et al., 2021). In summary, with respected to about all possible aspects the two studies differed (also in the location, experimental design, personnel conducting the experiment), but evaluated the same trait (tolerance against mildew).
In both studies the goal was to identify genes involved in mildew tolerance that may be useful in quinoa breeding. A comparison of the resulting GWAS results shows that there is no overlap between the two studies (Figure 9). Whereas the field trial revealed several candidate genes with high statistical power in genomic regions that may harbor disease resistance genes, the greenhouse study identified only one significant polymorphism with marginal statistical significance, which is located in the same region as the most significant SNP in the field study.
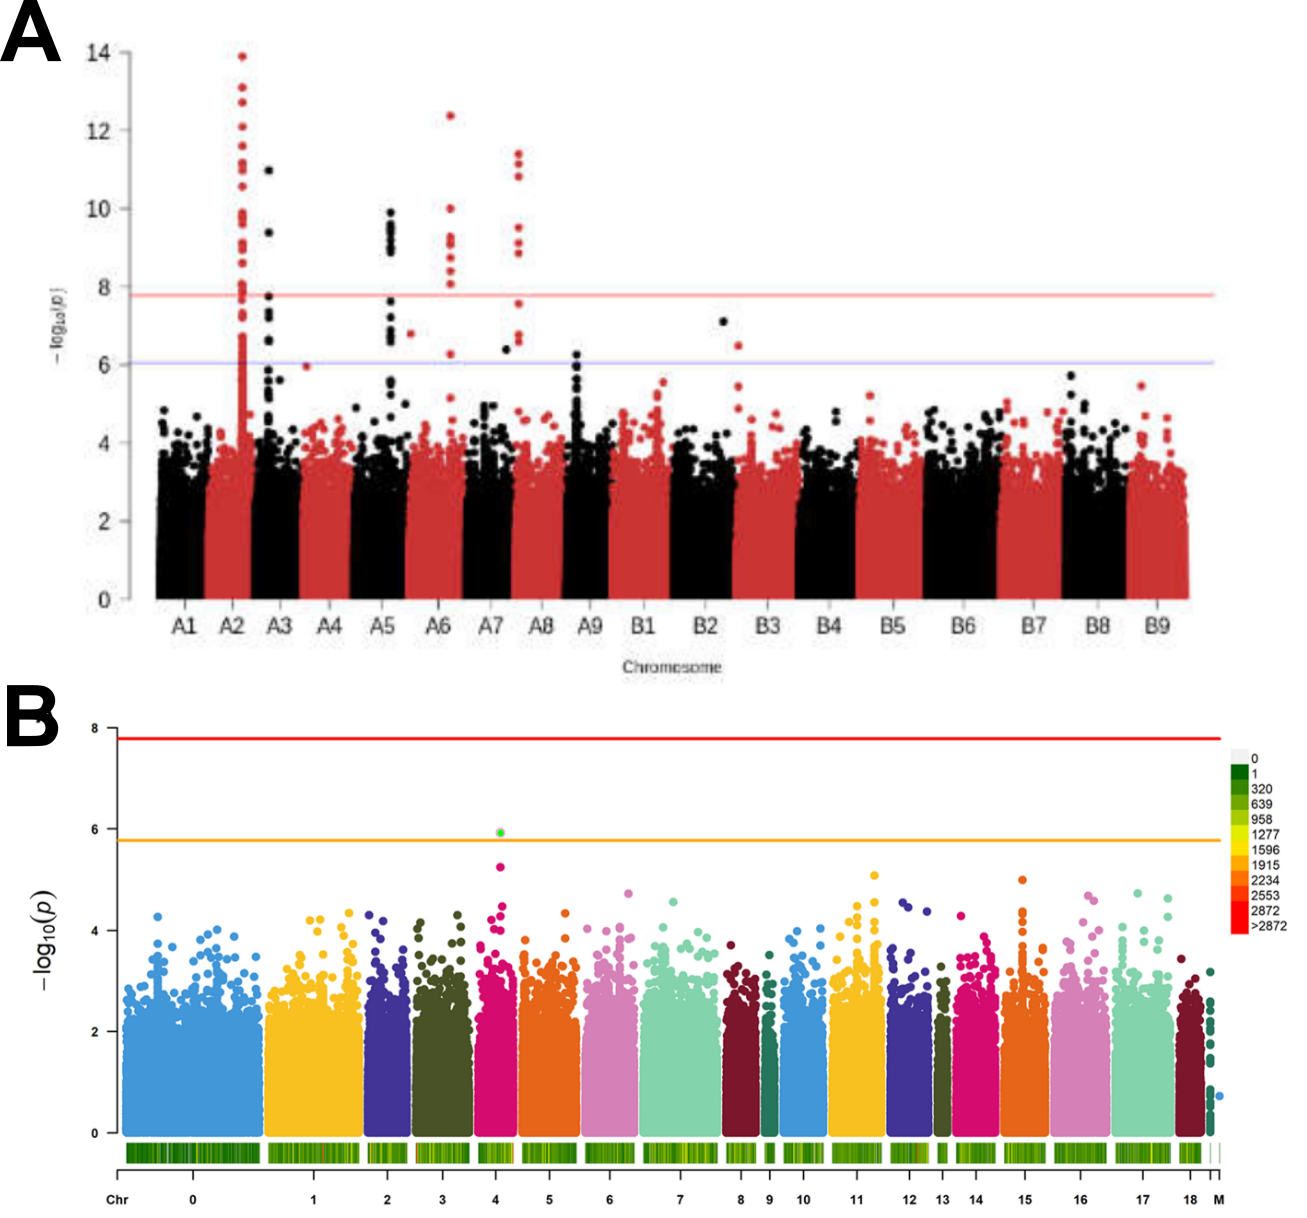
This comparison reveals that phenotypic characterization of plant genetic resources usually requires further validation by further genetic mapping or functional analyses. In this particular case, the higher statistical significance of the field trial is likely more trustworthy because of a almost five times larger number of genebank accessions tested, although the overlap of the most significant hit in both studies can be considered a confirmation of the results.
Controlled environments, however, may have an important advantage over field trials because they can be used to create conditions that allow to map adaptive phenotypes (e.g., the role of photoperiod, light composition and day length in time to flowering) or to synchronize the flowering of genetically diverse material in order to facilitate crossing of diverse genotypes, which would not be possible under field conditions. The manipulation of growing conditions, in particular light and temperature, to reduce generation time and synchronize flowering time is called speed breeding (Wanga et al., 2021; Watson et al., 2018). Although this principle has been described a long time ago, modern LED technologies and growth chambers greatly facilitate the use of this approach in both the characterization of phenotypic traits and breeding purposes. Detailed protocols were developed for multiple crops (Ghosh et al., 2018). For example, the manipulation of the ratio of red and far-red light with other colors is able to considerably shorten the time to flowering for amaranth (Figure 10), rice and soybean (Jähne et al., 2020).
Rapid development of phenotyping technologies
The phenotypic analysis of plants in general, but also more specifically, plant genetic resources is making great progress. A new field of plant phenomics is emerging, which makes used of very different technologies. They include classical phenotyping via image analysis, but also more advanced technologies such as spectroscopy with various methods, gene expression studies (transcriptomics), proteome analyses (proteomics), metabolic analysis (metabolomics), the analysis of "difficult" phenotypes such as roots or microscopic phenotypes such as the shape and density of leaf stomata using microscopy and various field based approaches facilitated by unmanned aerial vehicles (UAVs or drones), airplanes or satellites (Figure 11). In the context of plant genetic resources, the challenge is to develop scalable phenotyping instruments that are able to analyse a diverse and high level of phenotypic variation.
In addition to the generation of phenotypic data, their analysis also provides new challenges. First, large amounts of data are created, e.g., high density spectra, high-resolution pictures or fine-grained time-resolved measurements that require substantial computational competence and resources in the storage and analysis. New statistical and machine learning approaches, such as Deep Learning using Neural Networks are rapidly gaining acceptance and are widely used.
These developments need to be integrated into classical breeding paradigms because they require specialized domain knowledge (e.g., advanced statistics and computer science) but also allow new possibilities such as the characterization of new phenotypes, which my contribute to the identification and utilization of useful genetic variation.
Taken together, these technologies allow to overcome the plant phenotyping gap. This term was coined in response to the rapid development of genomics technologies, which allows to characterize genetic diversity in large numbers of genetic materials, whereas for a long time the phenotypic analysis was still limited to few traits and was resource intensive.
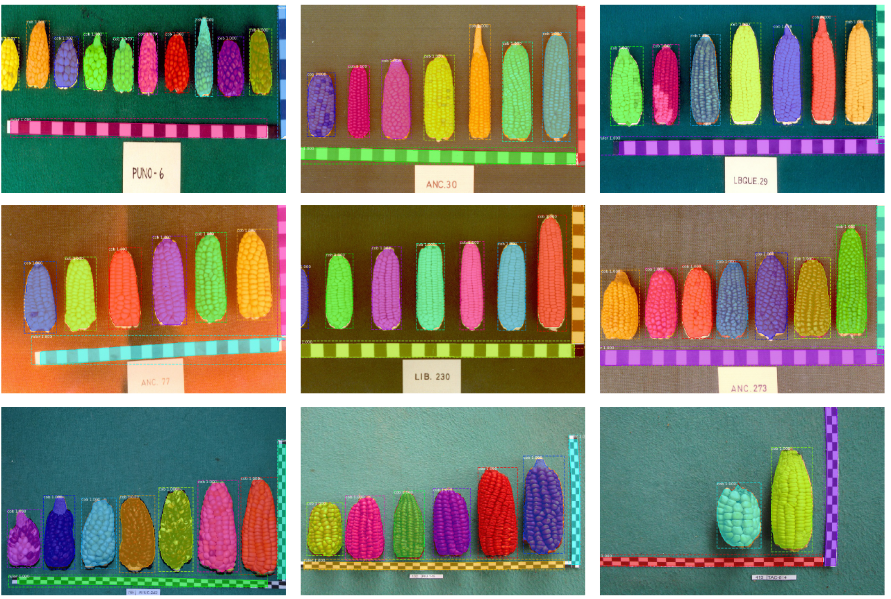
In the following one example of large scale phenotyping in the context of genebank phenomics is presented to demonstrate that large-scale analysis of phenotypic variation. The maize genebank of Peru was established in the 1960s and 1970s by collecting ca. 3,500 maize landrace populations from farmer's fields. All of these accessions with multiple plants per population were photographed together with a ruler. In 2015 the complete set of genebank accessions was cultivated again, and ca. 1,600 accessions still germinated. These were photographed again. Using a small training set of 200 or 1,000 annotated maize cob pictures, a Deep Learning model based on a co-called Mask R-CNN (CNN: Convolutional Neural Network) was trained to recognize the maize cobs and the ruler present on each photo (Figure 12). A comparison with other models showed that this variant of deep learning is vastly superior to classical mode of image analysis and another (simpler) deep learning method.
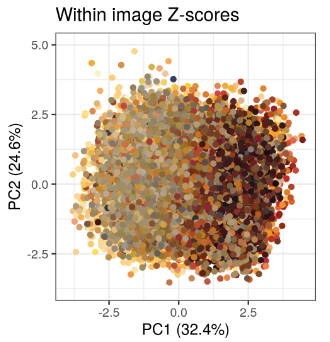
Using the trained model, almost 20,000 maize cobs were analysed and automatically measured. One initial analysis identified genebank accession that showed a high level of phenotypic variation to identify heterogenous genebank accessions. The PCA plot of within image Z-scores (a measure of phenotypic variation within genebank accessions) reveals that mean cob color and not morphological parameters are the main determinants of variation within genebank accessions.
The advantage of Deep Learning approaches is that (at least in the context of image analysis) they tend to be very robust and applicable in different circumstances. This is the reason why Mask-R CNN and related deep learning methods are now used for multiple applications in plant phenotyping, e.g., Yang et al. (2021).
The challenge of data storage and annotation
The large amount of data created by phenotyping applications and any information derived from these data is a big challenge at many levels. In the following the key challeneges will be mentioned, but not discussed in greater detail.
- Ownership of data:
- For scientific publication data are ideally public, however, since data are now becoming increasingly of commercial value, issues about ownership and freedom to use arise that require legal regulations
- Data storage:
- Data need to be stored in a digital form which requires resources appropriate data structures and software tools to read, process and synthesize data using application programming interfaces (API). Various initiatives have been initiated to tackle these problems, but solutions such as Breeding API (Selby et al., 2019) are only emerging slowly.
- Training of personnel:
- The field of data science is moving very fast, and the training of researchers and plant breeders needs to accommodate these rapid changes. Data scientist need to know and learn multiple new approaches for working with these data because traditional skills may not be sufficient anymore and new ways of collaboration need to be established.
- Data extraction and usage:
- The data extraction, formatting and synthesis from different sources needs to be automated. It is not sufficient anymore to only publish the data, but also tools and APIs that are tailored to specific big datasets.
Key concepts
| \(\square\) Genebank phenomics | \(\square\) Nested association mapping (NAM) |
| \(\square\) Multiparent advanced generation intercross (MAGIC) | \(\square\) Phenotyping bottleneck |
| \(\square\) Doubled haploid lines |
Summary
- Plant phenotyping is a very active field of plant research and will have a major impact on the description and utilization of plant genetic resources.
- The large scale phenotyping of PGR is facilitated by different populations used or created for phenotyping that accommodate different amounts and types of variation.
- The rapid development of phenotyping technologies facilitates the high-throughput and precise characterization of PGR among spatial and temporal scales.
- Novel phenotypes can be defined by using new technologies that may be interesting for downstream applications.
- Data storage and analysis are of major importance for plant phenotyping and creates new challenges in the training of personnel
Further reading
- Poorter et al. (2016b) - Very important analysis of phenotyping in the field and controlled environments
Review and discussion questions
- Despite the differences in phenotypic characterization in the field and the lab: Can you give pro's and con's for an evaluation of plant genetic resources in the field and in the lab?
- What are the advantages and disadvantages of the different populations created for characterizing phenotypic diversity (i.e., NAM or MAGIC populations). Are advantages and disadvantages different for the different uses, e.g., identification of genes vs. utilization of genetic resources for breeding?
- Can you imagine novel phenotypes that may become possible by any new -omics or phenotyping technologies?
- Which advantage do you see in the definition of new phenotypes that become possible my the new phenotyping methods?
- Which main challenges do you recognize in the training of students to accommodate the current developments in plant phenotyping, data storage and data analysis?
- Do you still see a future for the "breeder's eye" in such a technology-driven development of plant phenotyping?