Biodiversity
Motivation
The goal of this chapter is to define the different types of biodiversity, and to differentiate between natural biodiversity and agrobiodiversity. The term biodiversity was officially defined at the United Nations Conference on Environment and Development, Rio de Janeiro, Brazil in 1992 as1.
The variability among living organisms from all sources, including, ‘inter alia’, terrestrial, marine, and other aquatic ecosystems, and the ecological complexes of which they are part: this includes diversity within species, between species and of ecosystems.
For a history of the term ‘biodiversity’, check out the entry in Wikipedia.
This is also the official definition of the Convention on Biological Diversity (CBD), an internationally legal binding contract to preserve biodiversity2. We will discuss the legal aspects of exchanging biodiversity in the later chapter on the International Treaty on Plant Genetic Resources for Food and Agriculture.
2 See https://www.cbd.int/
Biodiversity can be divided into several types of diversity:
- Species diversity
- Ecosystem diversity
- Morphological diversity
- Genetic diversity
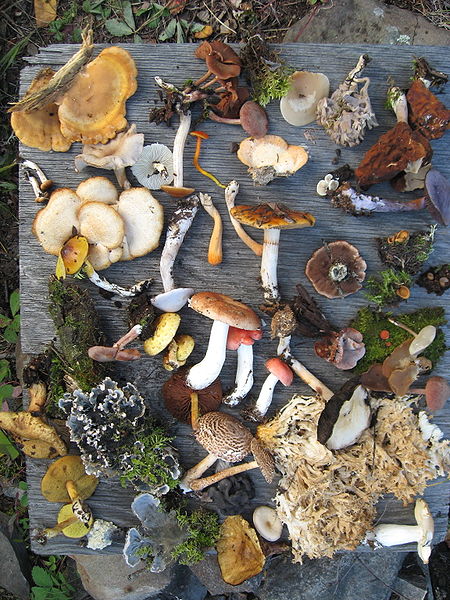
Some types of biodiversity are not immediately evident. For example, Figure 1 shows multiple species of fungi. It allows to get an impression of the morphological diversity of fungal species, and also of the species diversity. However, it does not allow to get an impression of the underlying genetic diversity (although the morphological diversity could be considered a proxy of generic diversity), because methods for characterizing genetic diversity are required. And it does not allow to get an impression of ecosystem diversity because the fungi in the pictuer were taken out of there ecological context. It is unknown from which ecosystems these fungi were collected, and the other species in the ecosystem remain unknown.
Of particular importance for our topic are species diversity and genetic diversity. ## Learning goals
To be added ## Species diversity
Species diversity includes the number of species present globally or in a particular ecosystem. Different taxonomic groups have very different numbers of species recognized (Figure 2).
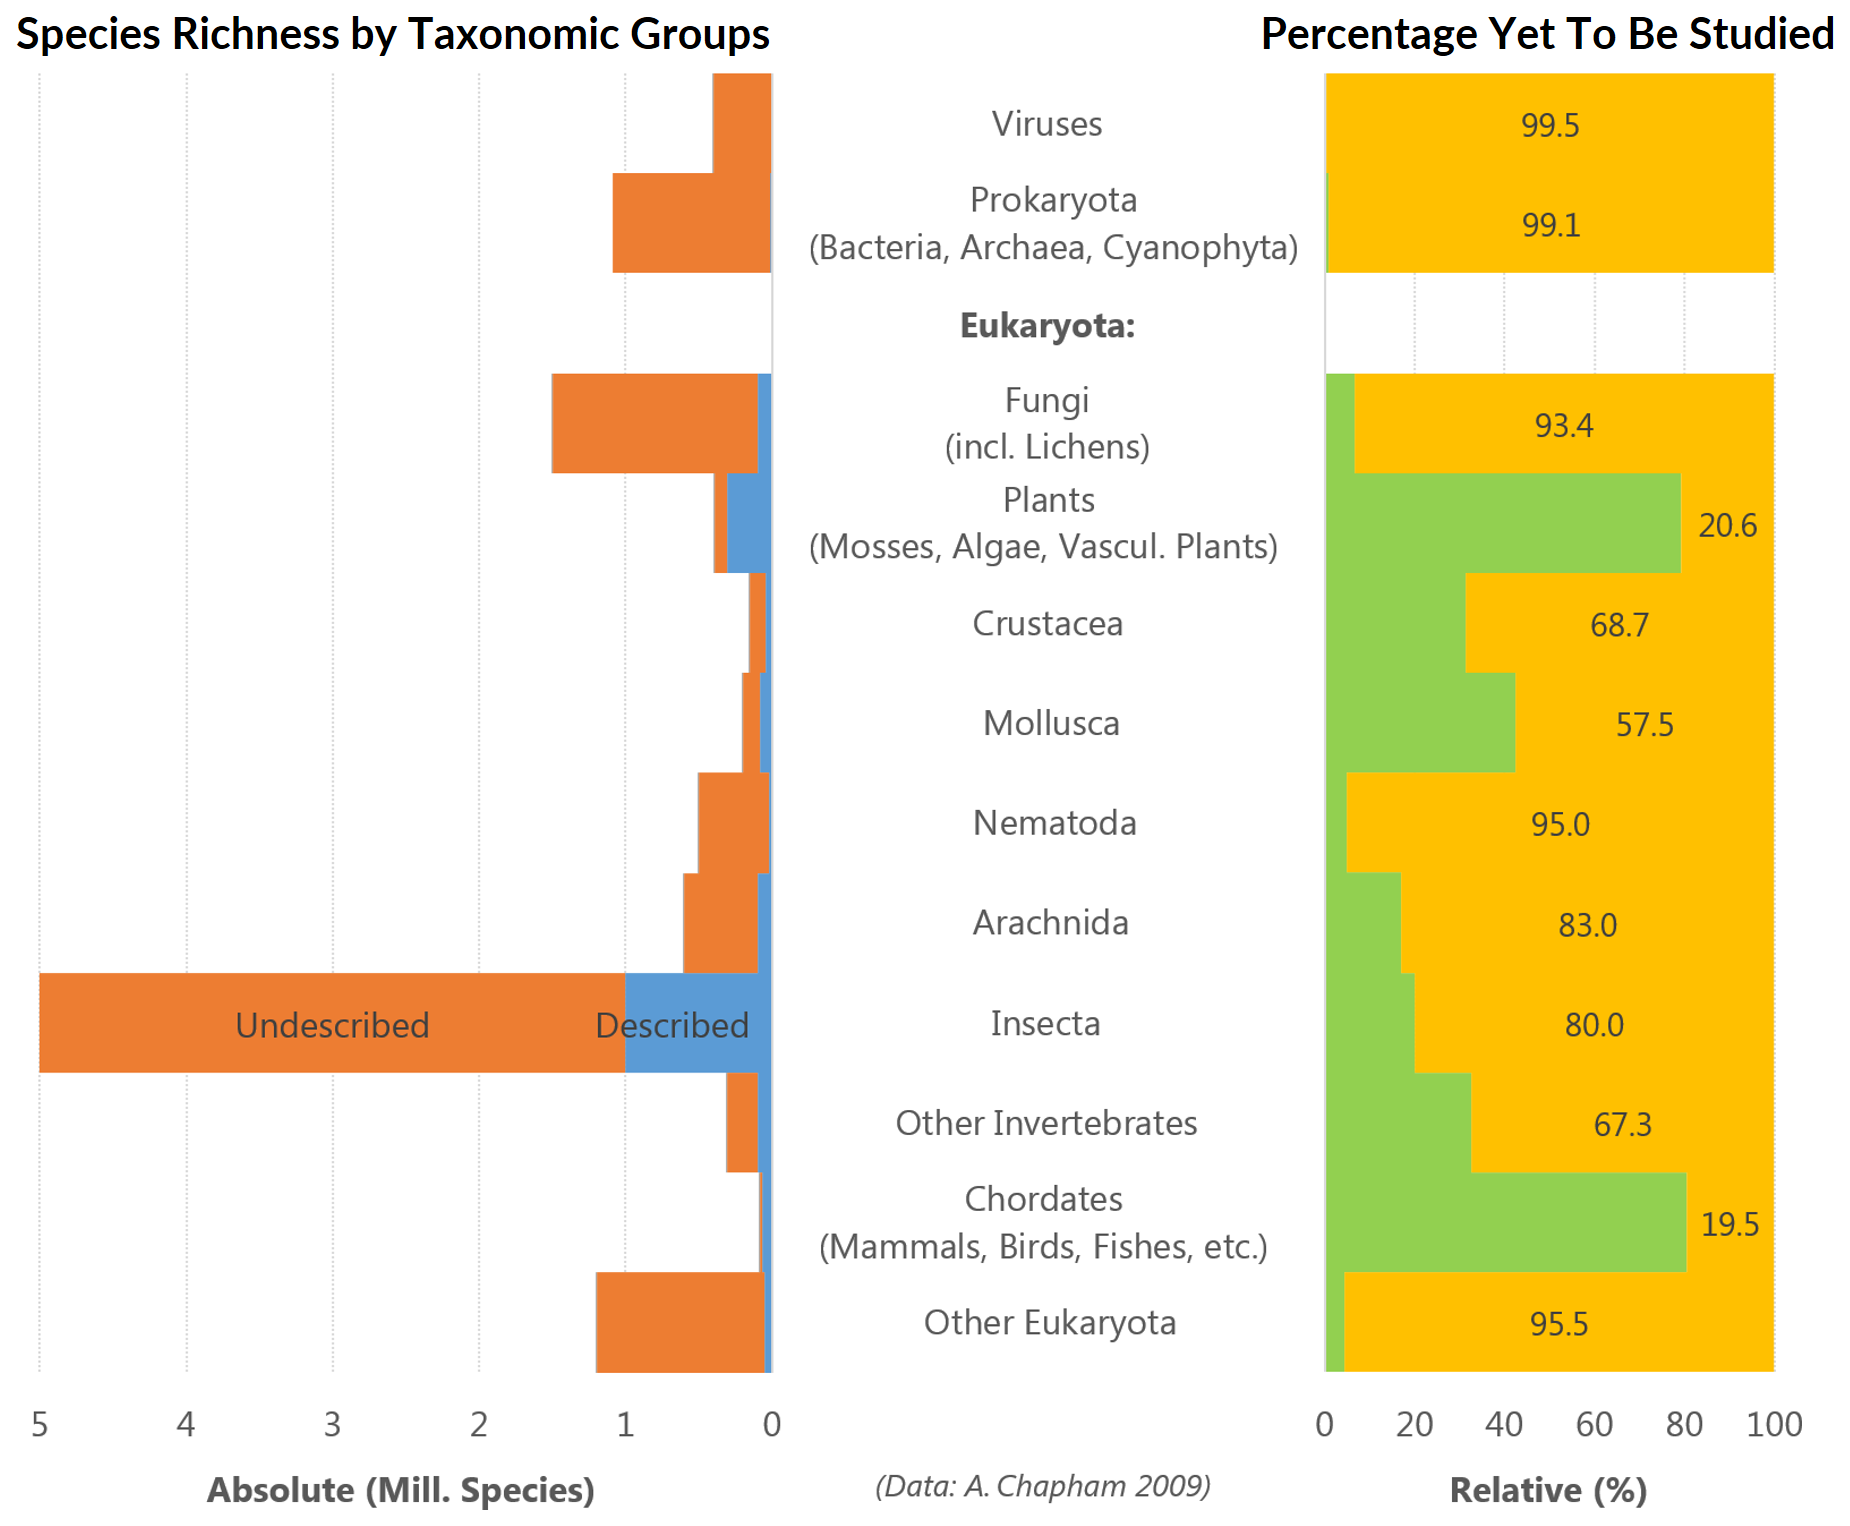
The figure also shows that total number of species described is highly variable among groups, and the estimated number of total species for most groups is much higher than the currently known numbers, which suggests that are large number of species are still to be discovered.
One important aspect of biodiversity is that species numbers are very unequally distributed across the globe. Figure 3 shows geographic distribution of the so-called biodiversity hotspots, which are geographic areas with a very high number of species. From this figure it is evident that the hotspots are predominately located close to the Equator, on islands, in mountain regions and in regions close to the sea.
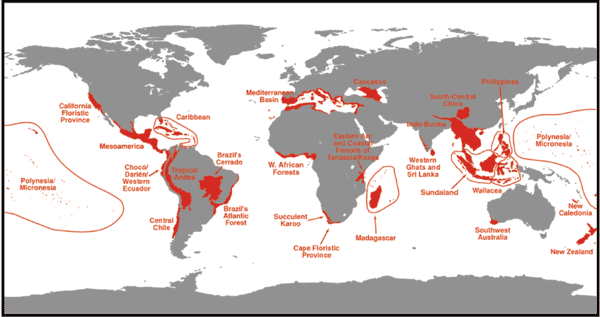
The study of Myers et al. (2000) also identified the most important biodiversity hotspots. They found that the Tropical Andes are the most important hotspot with 45,000 described species, followed by the Mediterranean Basin and Sundaland (South East Asia) with 25,000 species each.
In many cases the hotspots are defined by the proportion of endemic species. Endemic species are restricted to small geographic regions and do not occur in other regions. With respect to plants, some regions have a very high proportion of endemic species. For example, the tropical Andes harbor 45,000 plant species, of which 20,000 or 6.7% are classified as endemic. Overall, 133,149 species are endemic, which corresponds to a fraction of 44% of all know plant species.
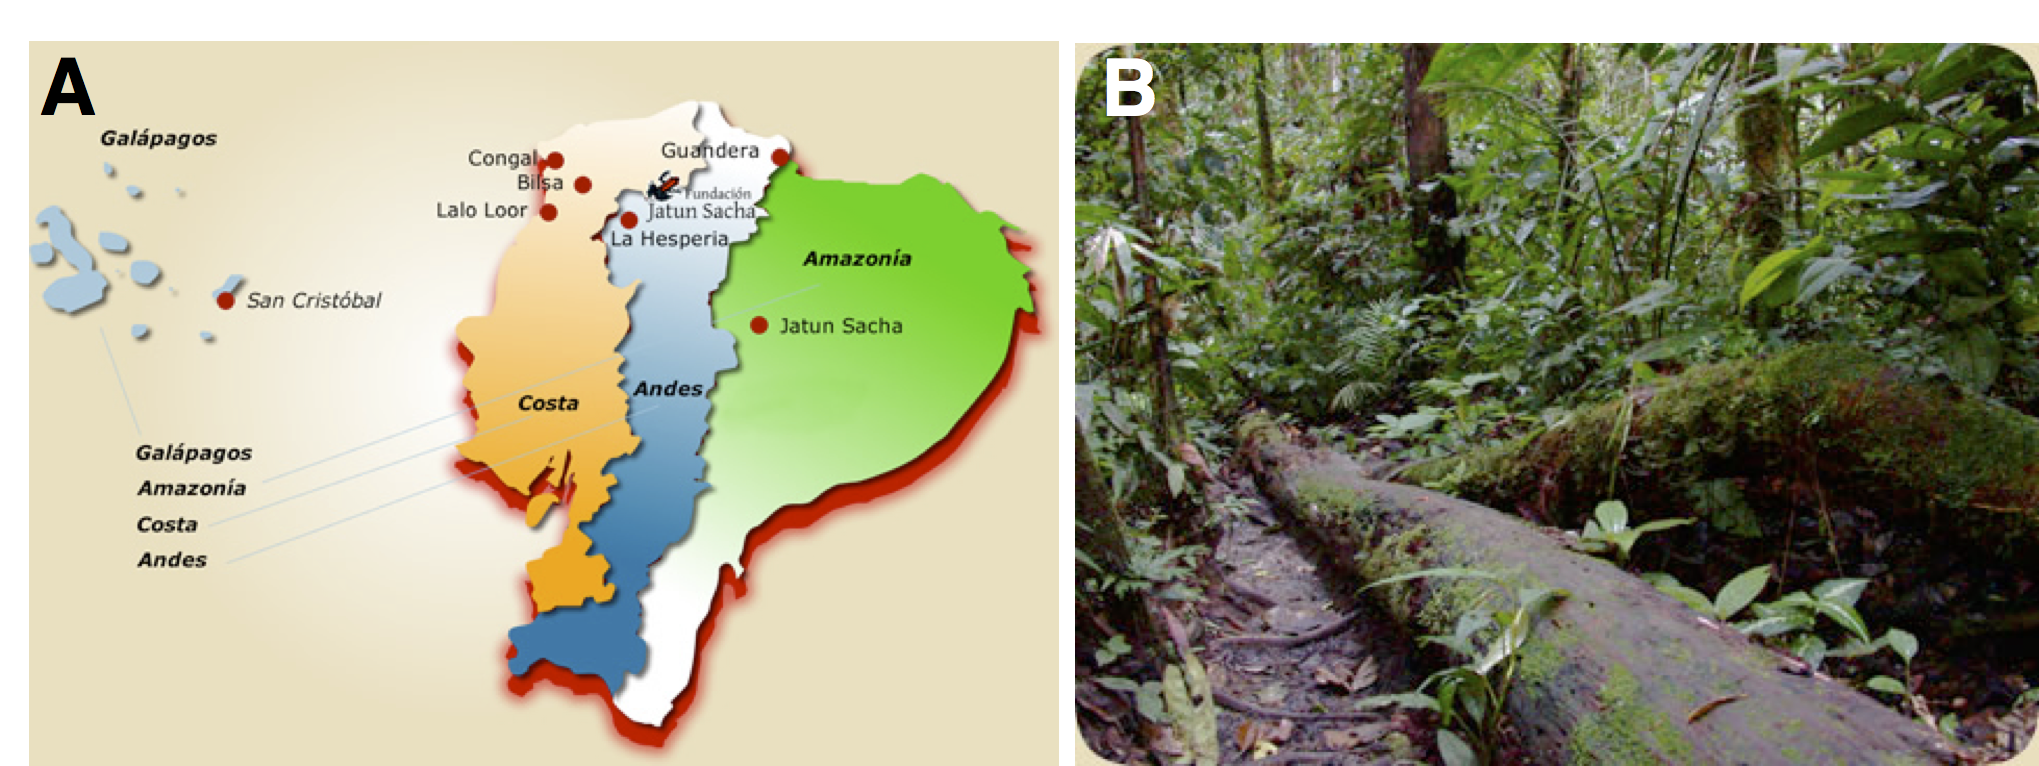
As an example of a tropical Andes biodiversity hotspot, the Jatun Sacha Ecological Reserve in the Ecuadorian Rain Forest (Figure 4) harbors about 600 species of trees in only a few km\(^2\) (Figure 4), which is a larger number of tree species than in all of North America!3
3 See also the example from Peruvian rain forests in the talk of Elizabeth Kolbert https://youtu.be/avoq05Z1K6w?t=1729
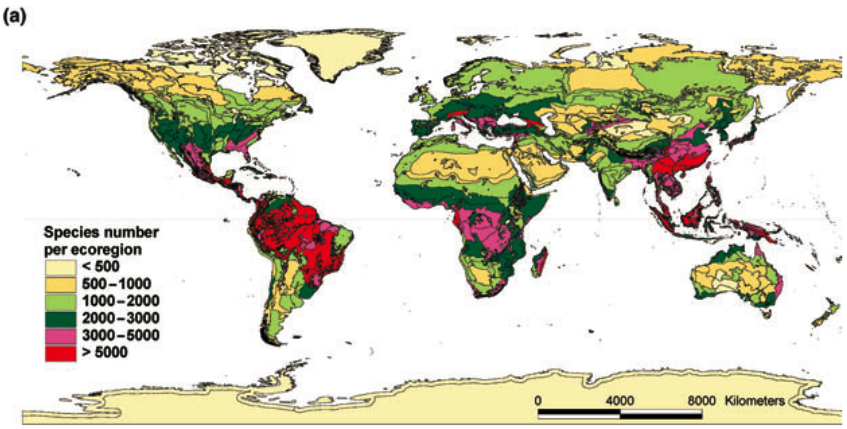
The biodiversity hotspots defined by Myers et al. (2000) are based on known species from all major taxonomic groups. However, a very similar pattern, namely an unequal distribution of plant species across the globe, can be seen for plants (Figure 5). The geographic distribution of plant species across the globe shows that in particular ecoregions with a tropical and Mediterranean climate harbor a large number of plant species.
As can be easily seen from the geographic distribution of biodiversity hotspots, biodiversity is not randomly distributed but follows some rules. Some of the most important correlations between biodiversity (defined as numbers of species, species richness) and environmental parameters is shown in Figure 6.
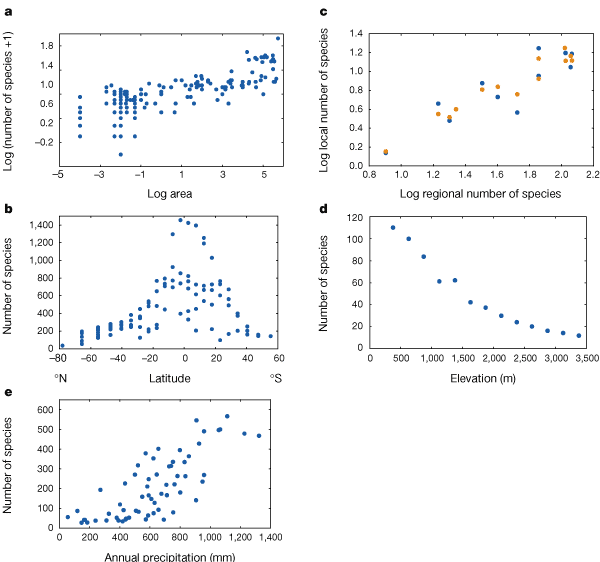
The general rules for the distribution of species shown in the figure can be summarized as follows:
- Species-area relationship
- Numbers of earth worms in (arbitarily defined) geographic regions ranging from 100 m2 to >500,000 km2 across Europe.
- Species-latitude relationship
- Birds in grid cells (\(\approx\) 611,000 km2) across the New World.
- Relationship between local and regional richness
- Lacustrine fish in North America (orange circles: large lakes; blue circles, small lakes).
- Species elevation relationship
- Bats in Manu National Park & Biosphere Reserve, Peru.
- Species-precipitation relationship
- Woody plants in grid cells (20,000 km2) in southern Africa.
The value of plant biodiversity
The value of biodiversity can be expressed as its economic value and may defined at several levels:
- Environmental services
- The value of biodiversity for general ecosystem functions such as the production of oxygen, the removal and storage of CO\(_2\) or the cleaning of water.
- Tourism
- Generating income by tourists who visit regions rich in biodiversity.
- Natural products
- Materials and compounds extracted from wild species such as pesticides, medicines and materials.
- New (alternative) plant species
- For food and feed supply, biomass production, bioeconomy.
Examples for alternative plant species are minor crops or orphan crops like amaranth or quinoa, which are locally important crops in the Andean regions, and which can be developed into crops for other regions of the world by plant breeding and related technologies.
Also, crop wild relatives (CWR) are an important component of biodiversity, because they either can be neo-domesticated into new crops or be used as genetic resources of existing crops.
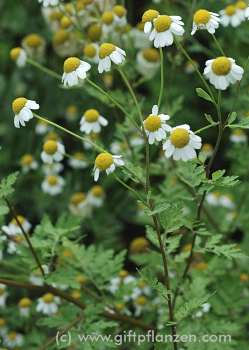
The extraction of pesticides from plants is one example for the economic value of biodiversity. For example, the Dalmatian chrysanthemum Tanacetum cinerariifolium (Wikipedia) occurs on the balkans and produces the insecticide pyrethrum, which is a very widely used insecticide (Figure 7).
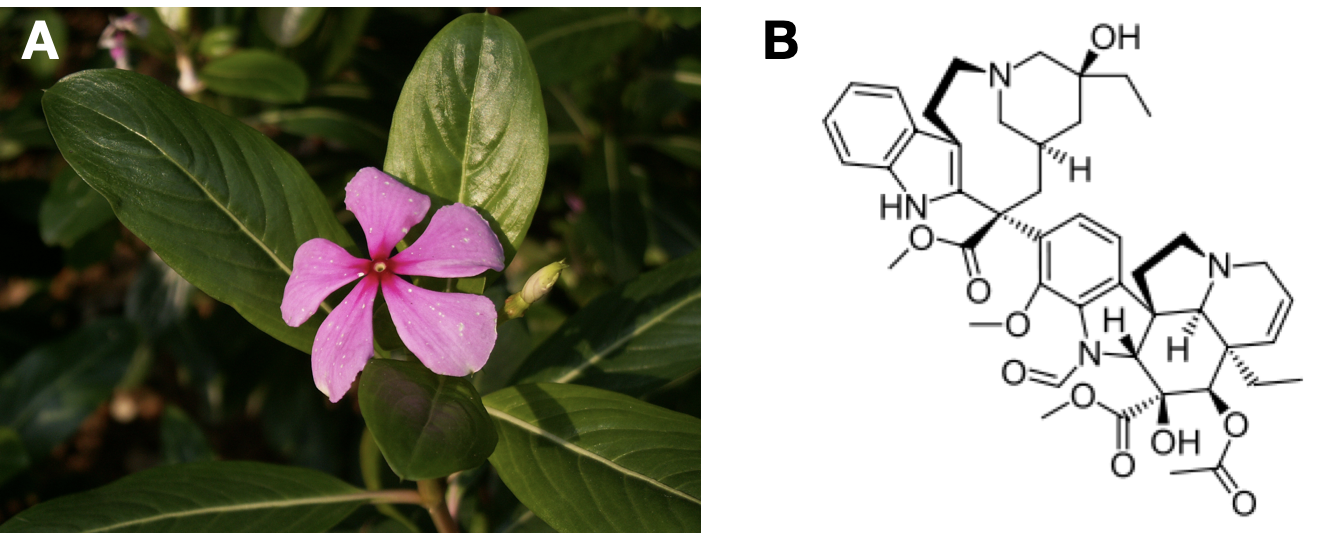
Another important use of biodiversity is the extraction of medicines from plants. The Madagascar periwinkle, Catharanthus roseus (Wikipedia) produces at least 50 alkaloids (Figure 8). One of them is vincristine, which acts as a cytostatikum against tumors by inhibiting the growth of cells. It has been a hugely successful drug for cancer treatment and was discovered by bioprospecting, i.e., the screening of biodiversity for potentially useful chemical compounds.
Diversity of plants used by humans
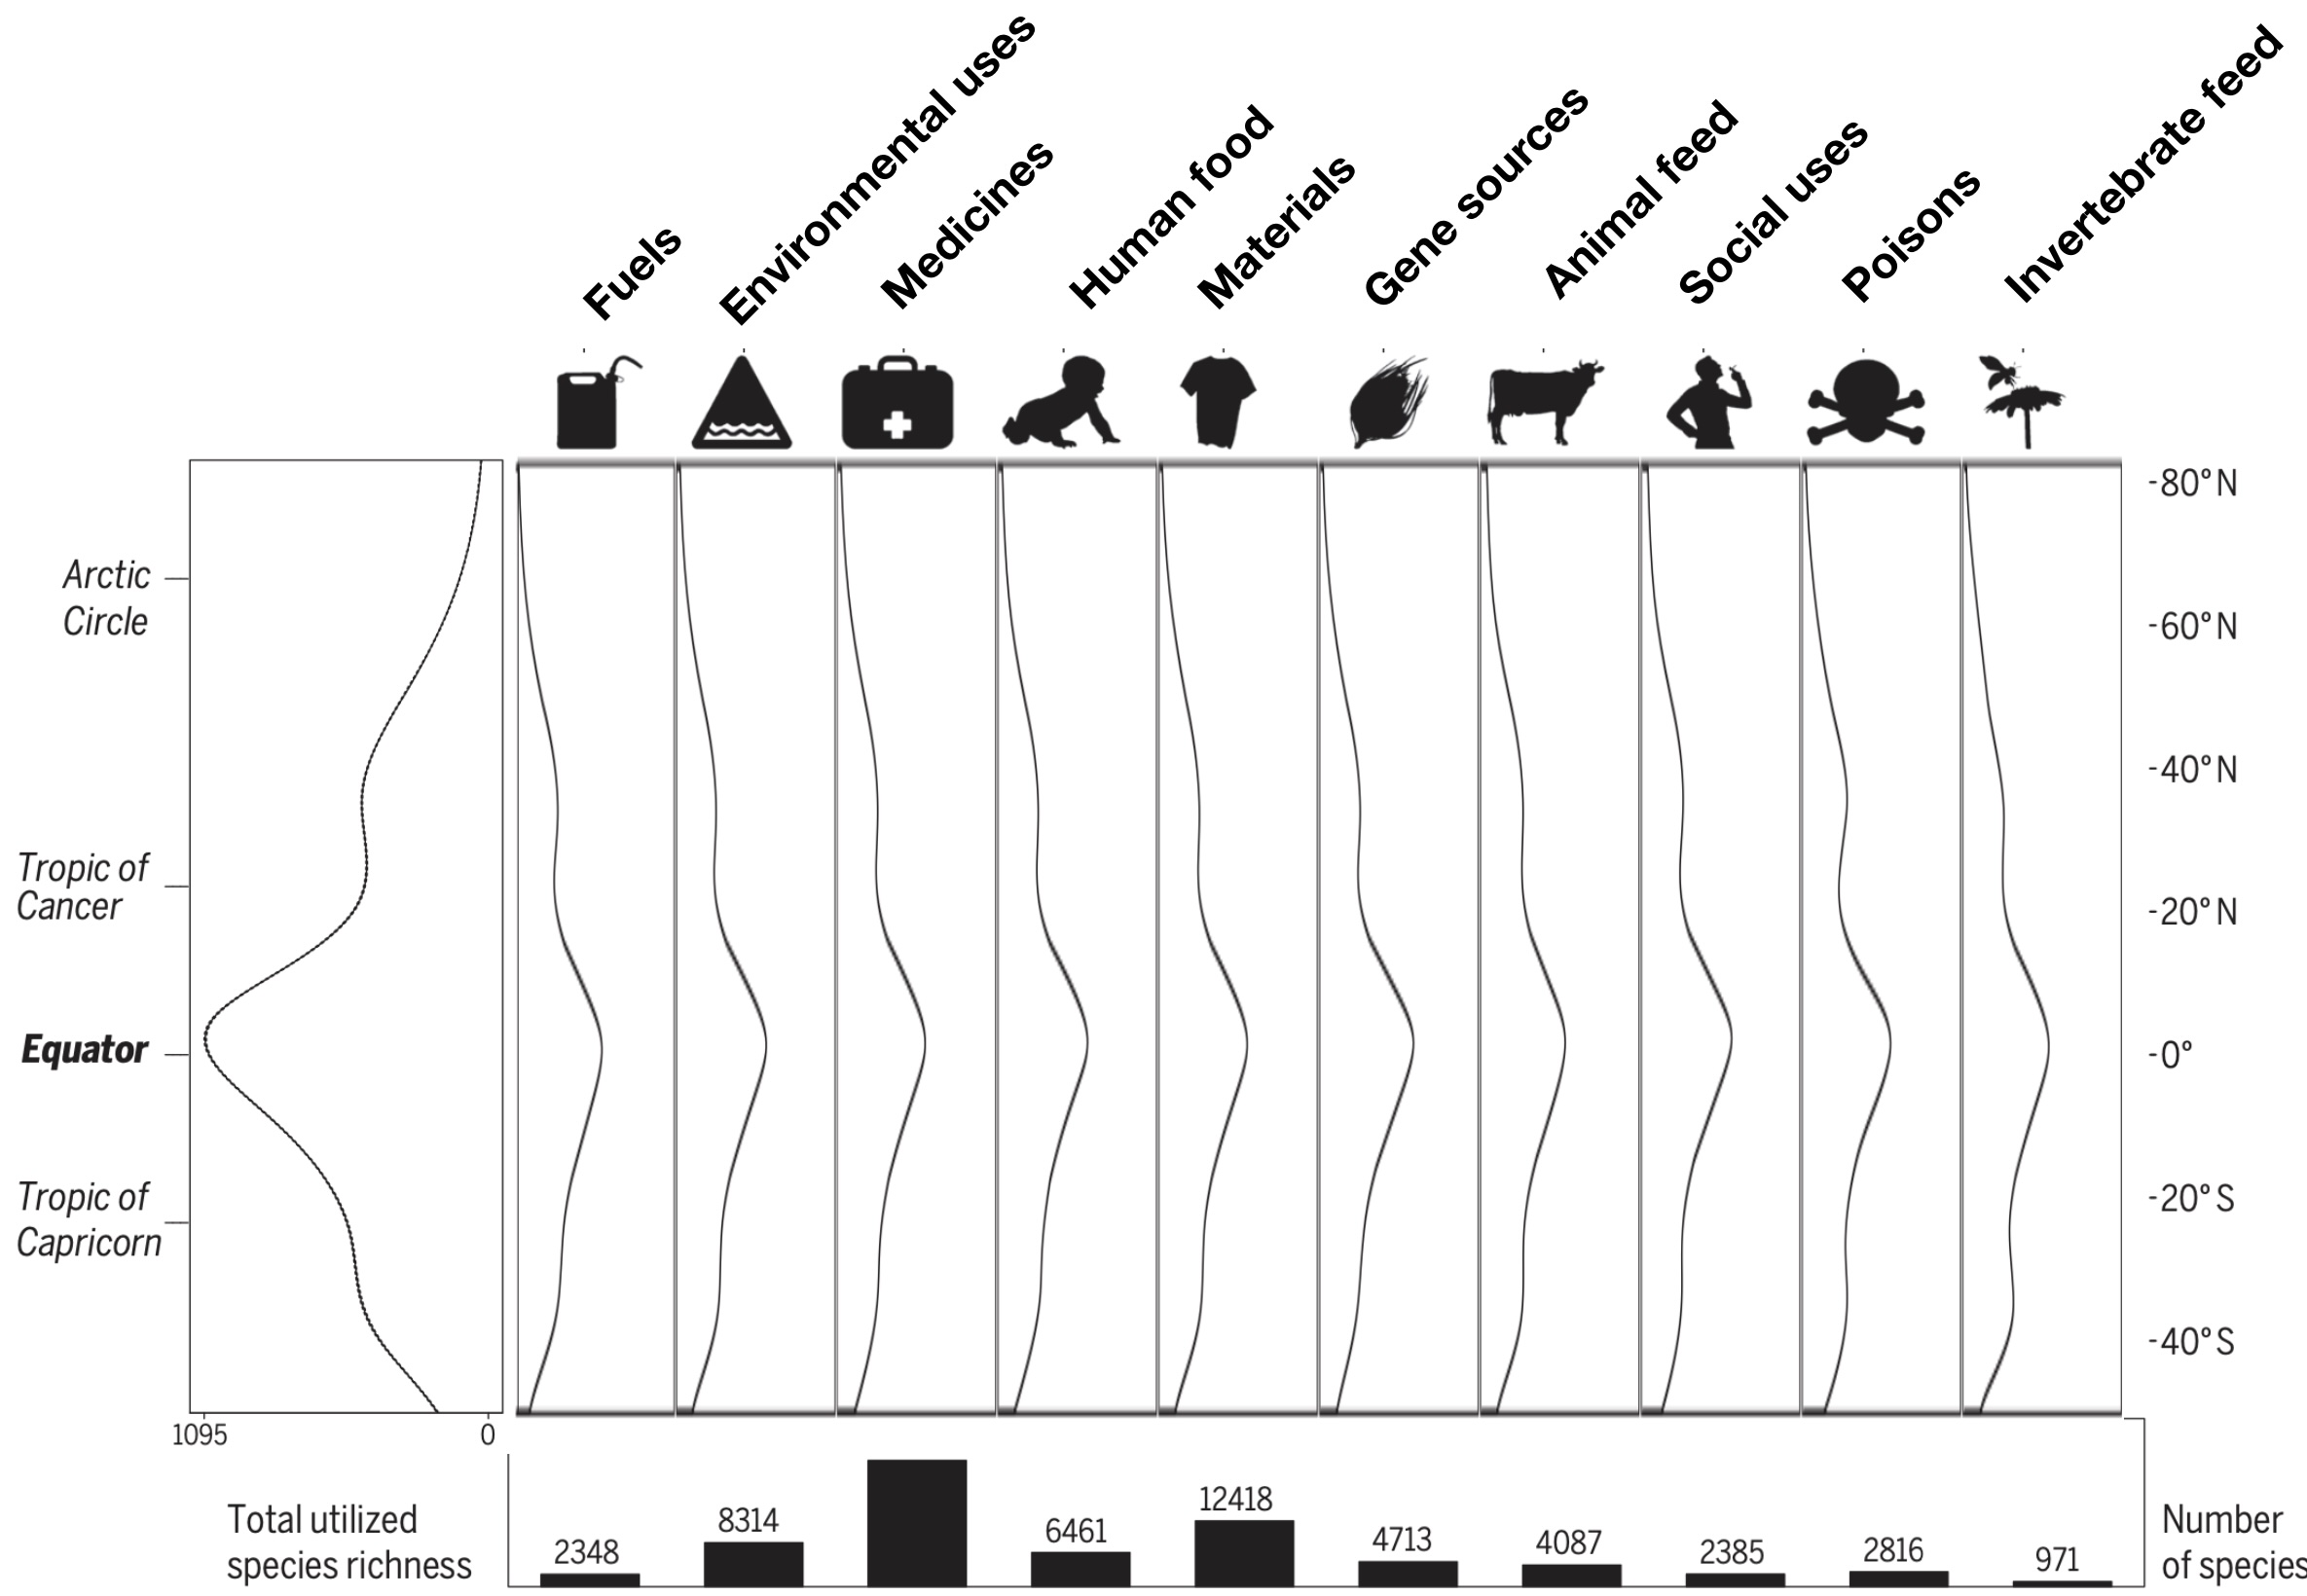
The analysis of the global distribution of plants used by humans shows how general principles of the geographic distributions of plant species are directly linked to species used by humans for various purposes.
A survey of 35,687 plant species spanning 10 criteria such as food, medicine and materials shows the majority of these species is located in the tropics around the equator, just as all plant (and animal) species in general (Figure 9) Pironon et al. (2024).
The authors found that utilized plant species richness is highly positively correlated with total plant species richness (Figure 10 A), but also with cultural diversity in different regions (Figure 10 B)
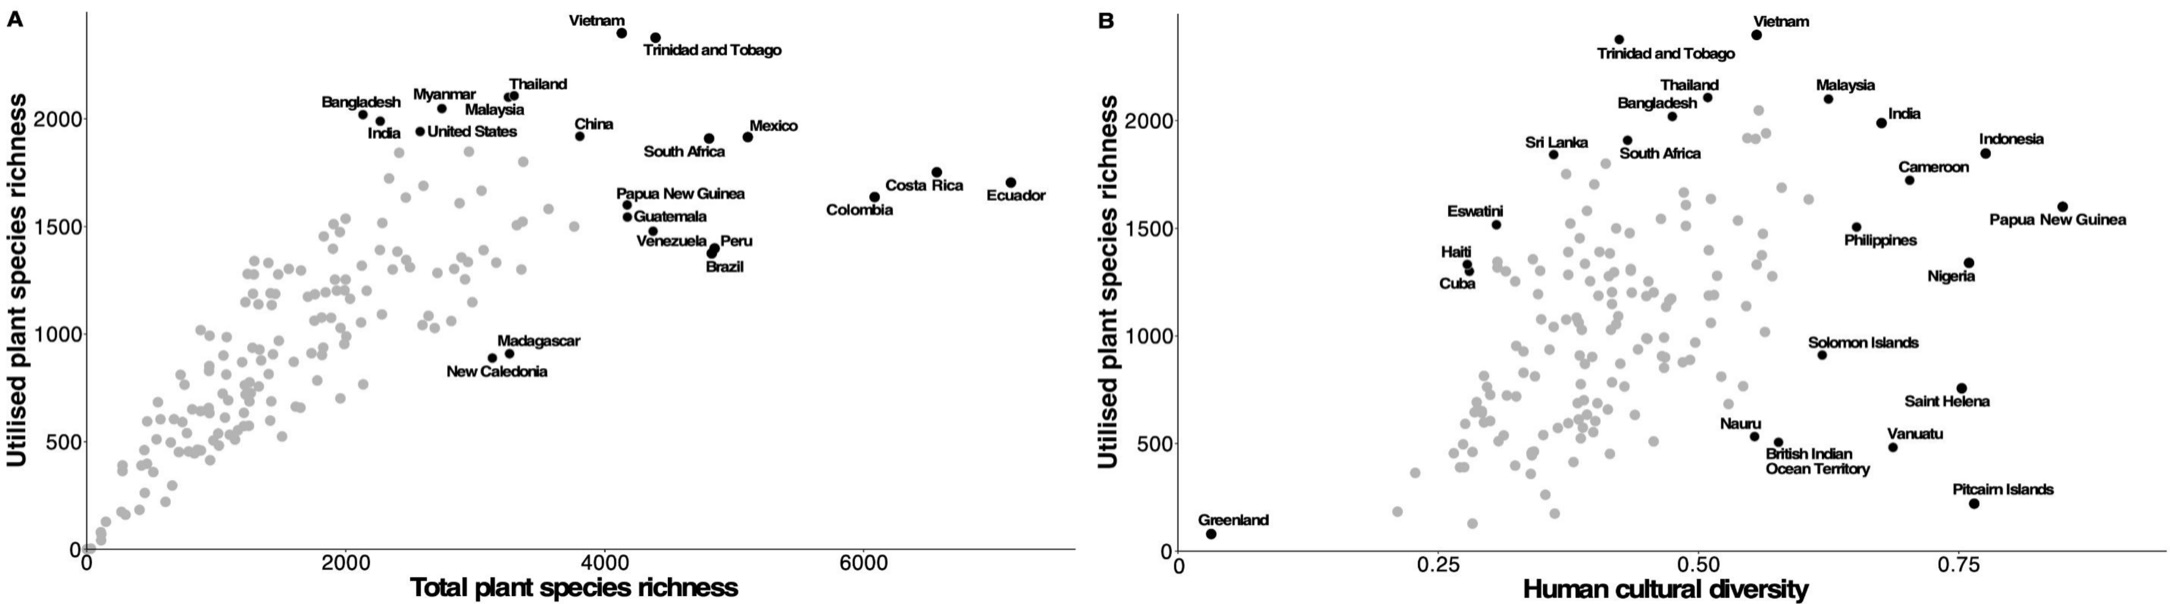
One consequence of this study is that the protection of biodiversity in general by assigining preserved areas will also benefit species that are used by humans.
The close connection between general levels of biodiversity and the biodiversity of plant used by humans provides an argument why the conservation of biodiversity is an essential component to maintain food security as one of the key long term goals of agriculture and plant breeding. Dannenberg et al. (2024) provide several arguments why the conservation of biodiversity contributes to food security.
Agrobiodiversity
Agrobiodiversity or agricultural biodiversity is defined as the subset of the total biodiversity that is related to agriculture and human well-being. This includes plants and livestock, but also pests, pathogens, pollinators etc. According to the FAO definition4, agrobiodiversity
encompasses the variety and variability of animals, plants and micro-organisms which are necessary to sustain key functions of the agroecosystem, its structure and processes for, and in support of, food production and food security
Thus, it is the subsection of biodiversity that is directly of use for, und utilized by humanity. Of particular importance are plant crops and their wild relatives. Agrobiodiversity consists of different components:
The diversity of ecosystems includes agricultural fields, meadows, and natural habitats. Natural habitats surrounding fields and meadows are important because they provide ecosystem functions for the former two types of ecosystems. This type of diversity is based on the extent of interactions between species.
The diversity of crop plants can be subdivided into the main crop species, lesser crops, as well as into modern varieties and land races. This diversity focuses on taxonomic diversity of species.
There are other components of agrobiodiversity that accompany or influence agrobiodiversity in the narrow sense. They include:
- Related wild species (crop wild relatives, CWR), meadow plants
- ‘Deleterious’ agrobiodiversity: Weeds, pests, pathogens
- Useful agrobiodiversity like pollinators, soil fauna or microorganisms
- Diversity of livestock
Major and minor crop plants
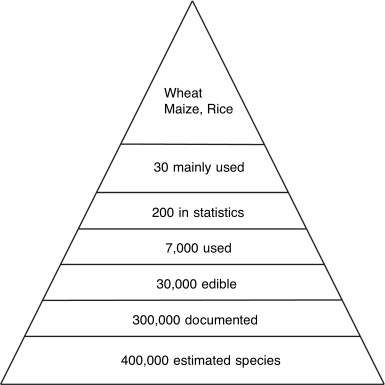
If we classify the number of plant species in different groups with respect to their (immediate) usefulness for humans, some striking patterns emerge (Figure 11):
- Only a very small proportion of available plant species is used by humans
- Crop plants can be divided into major crops and minor crops
- Only three major crops provide the vast majority (>90%) of the calories for human and livestock nutrition
6 See Wikipedia for a definition of a long tail in a distribution.
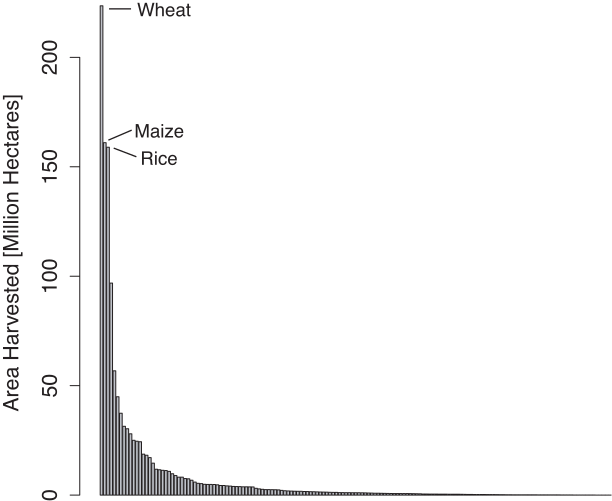
The differentiation between major and minor crops becomes evident, if the global cultivation area of each plant is plotted as in Figure 12. The data are taken from the FAOSTAT database of FAO, which contains statistics about the use of crop plants.5 The figure shows that there is a long tail of minor crops that are cultivated on a small area.6 However, these crops can be of great importance and even be a major crop locally.
With respect to the future of plant breeding and the use of plant genetic resources, Figure 11 and Figure 12 suggest key decisions that need to be taken if available resources are limited:
- Should one focus on improving the three key crops?
- Should the yield of other main crops increased by breeding to make them more competitive to the three major crops?
- Should one breed minor crops into competitive crops so that they can become major crops?
- Is the domestication of new crops an useful strategy?
In the decision that need to be taken, there are several stakeholders who are involved in the improvement and cultivation of crops.
- Political bodies
- Agricultural researchers
- Commercial plant breeders
- Farmers
- Consumers
They tend to have different interests, which influence the future of crop species, their cultivation and their utilization.
Lesser used crops
There is currently a great interest in improving minor crops, which are also frequently called orphan crops or *neglected and underutilized species (NUS)** Lesser used crops can be defined by different criteria. On definition of orphan crops is, for example7,
Orphan crops are a diverse set of minor crops like tef, finger millet, yam, roots and tubers that tend to be regionally important but not traded around the world and receive no attention by research networks. Developing countries however rely on these crops more heavily than rice and wheat that are researched heavily by private corporations.
Some lesser used crops are restricted to certain geographic regions, where they can be of great local importance. Examples for such locally importand food crops are:
- Teff (Eragrostis tef), a key crop in Ethiopia, but little cultivation area outside (Wikipedia)
- Yam (Wikipedia)
- Bambara peanut (Wikipedia)
- Amaranth (Amaranth)
- Buckwheat (Wikipedia)
Other minor crops can be classified by the type of plant or their use:
- Vegetables, fruits, medicinal plants
- Tree species
- Fodder crops/feed crops
One example of a minor food crop is buckwheat, Fagopyrum esculentum (Figure 13). It belongs to the family Polygonaceae and is cultivated in Asia, Russia, North America, Central and Western Europe.
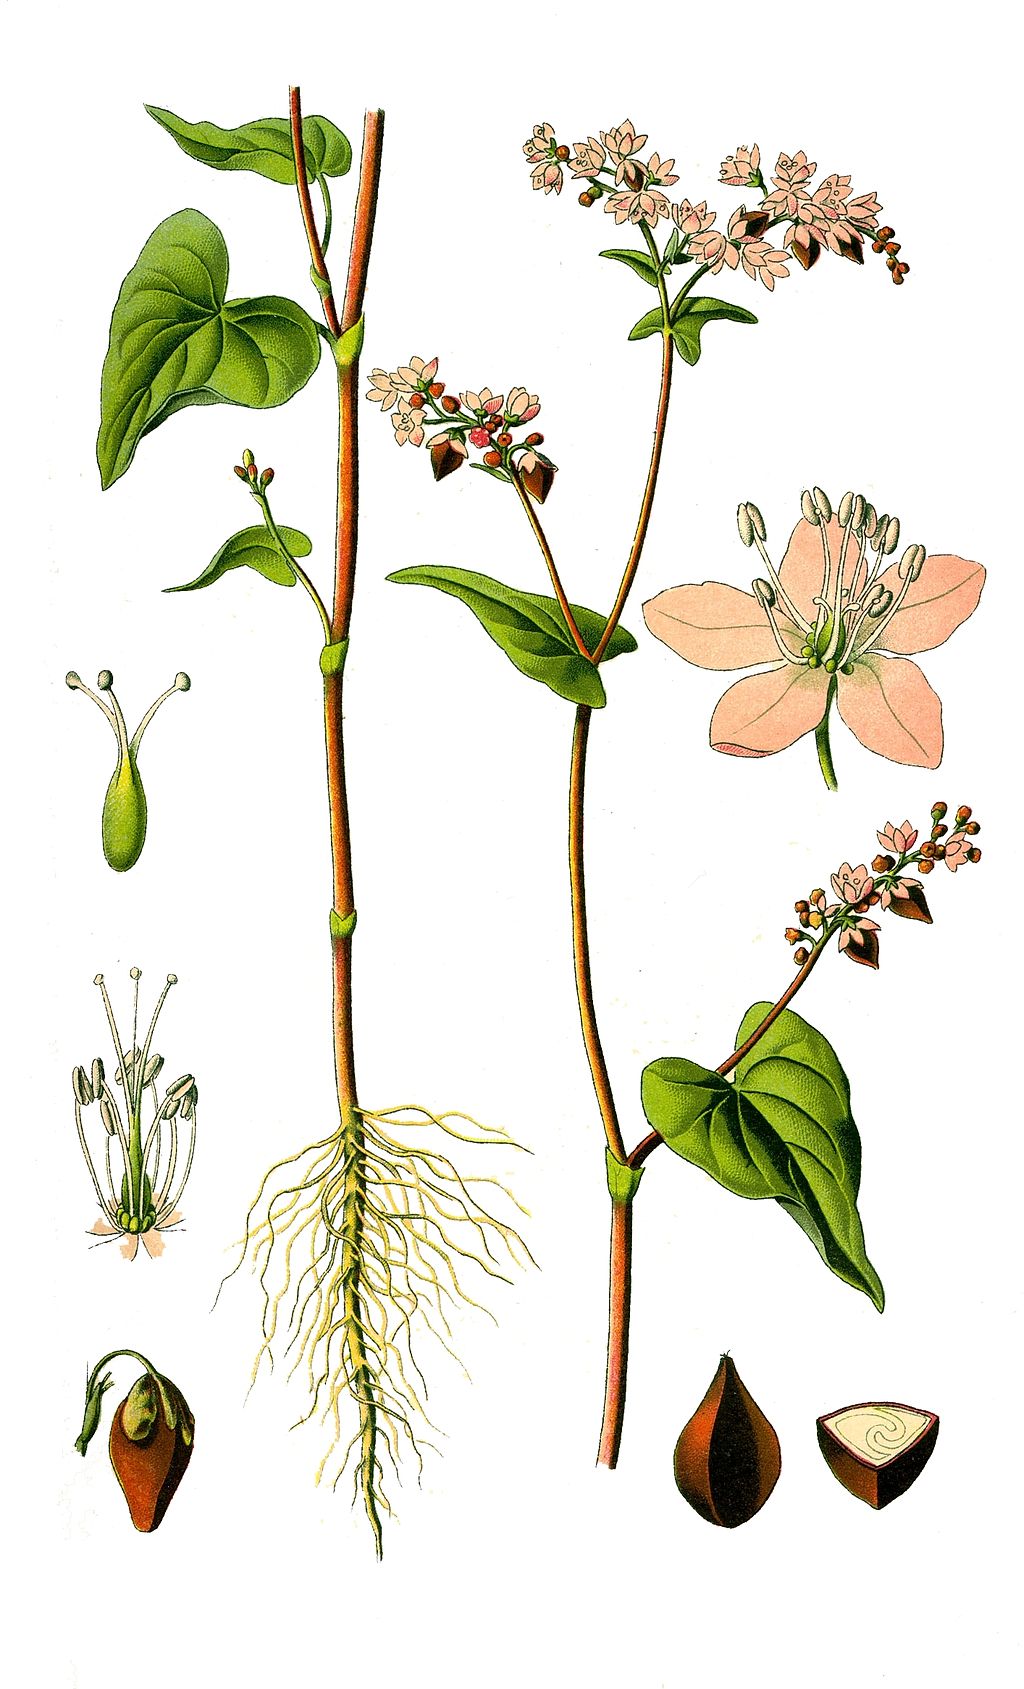
Buckwheat is an undemanding, rapidly growing, but frost sensitive plant and it grows on poor sandy soils. The yield ranges from 5 to 20 dt/ha, which is not very high. This crop has different uses as food plant (grouts, porridge, flour additive from fruits), but also a fodder plant, green manure, bee food.
A key characteristic is its high protein content in the seeds with 10% protein, 70% carbohydrates, 2% fat in grain. Although buckwheat has an important component of the Eastern European and Russian cuisine for a long time, it is now becoming a popular crop because of its favorable nutrient composition.
Changes in (agro)biodiversity
The concept of biodiversity is accompanied by the notion that biodiversity is lost due to various reasons. Figure 14 shows the change in biodiversity in Germany since 4.000 years by estimating species numbers of ferns and flowering plants at different time periods in history.
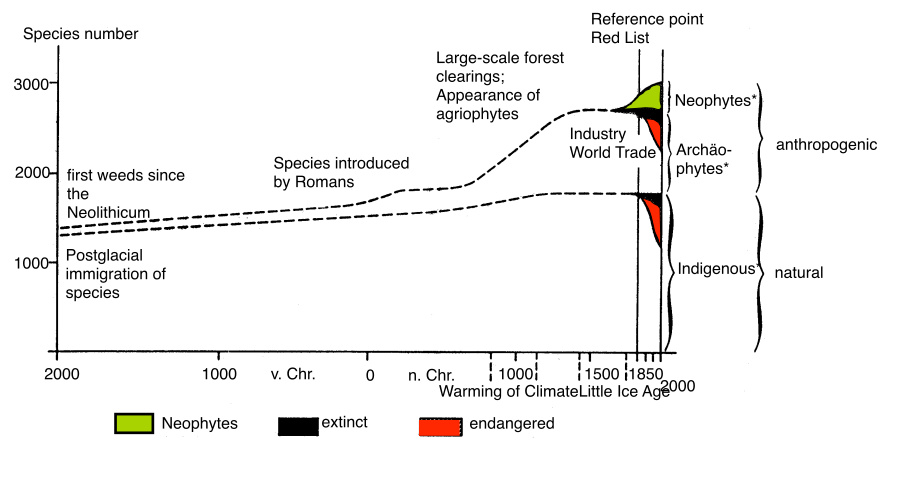
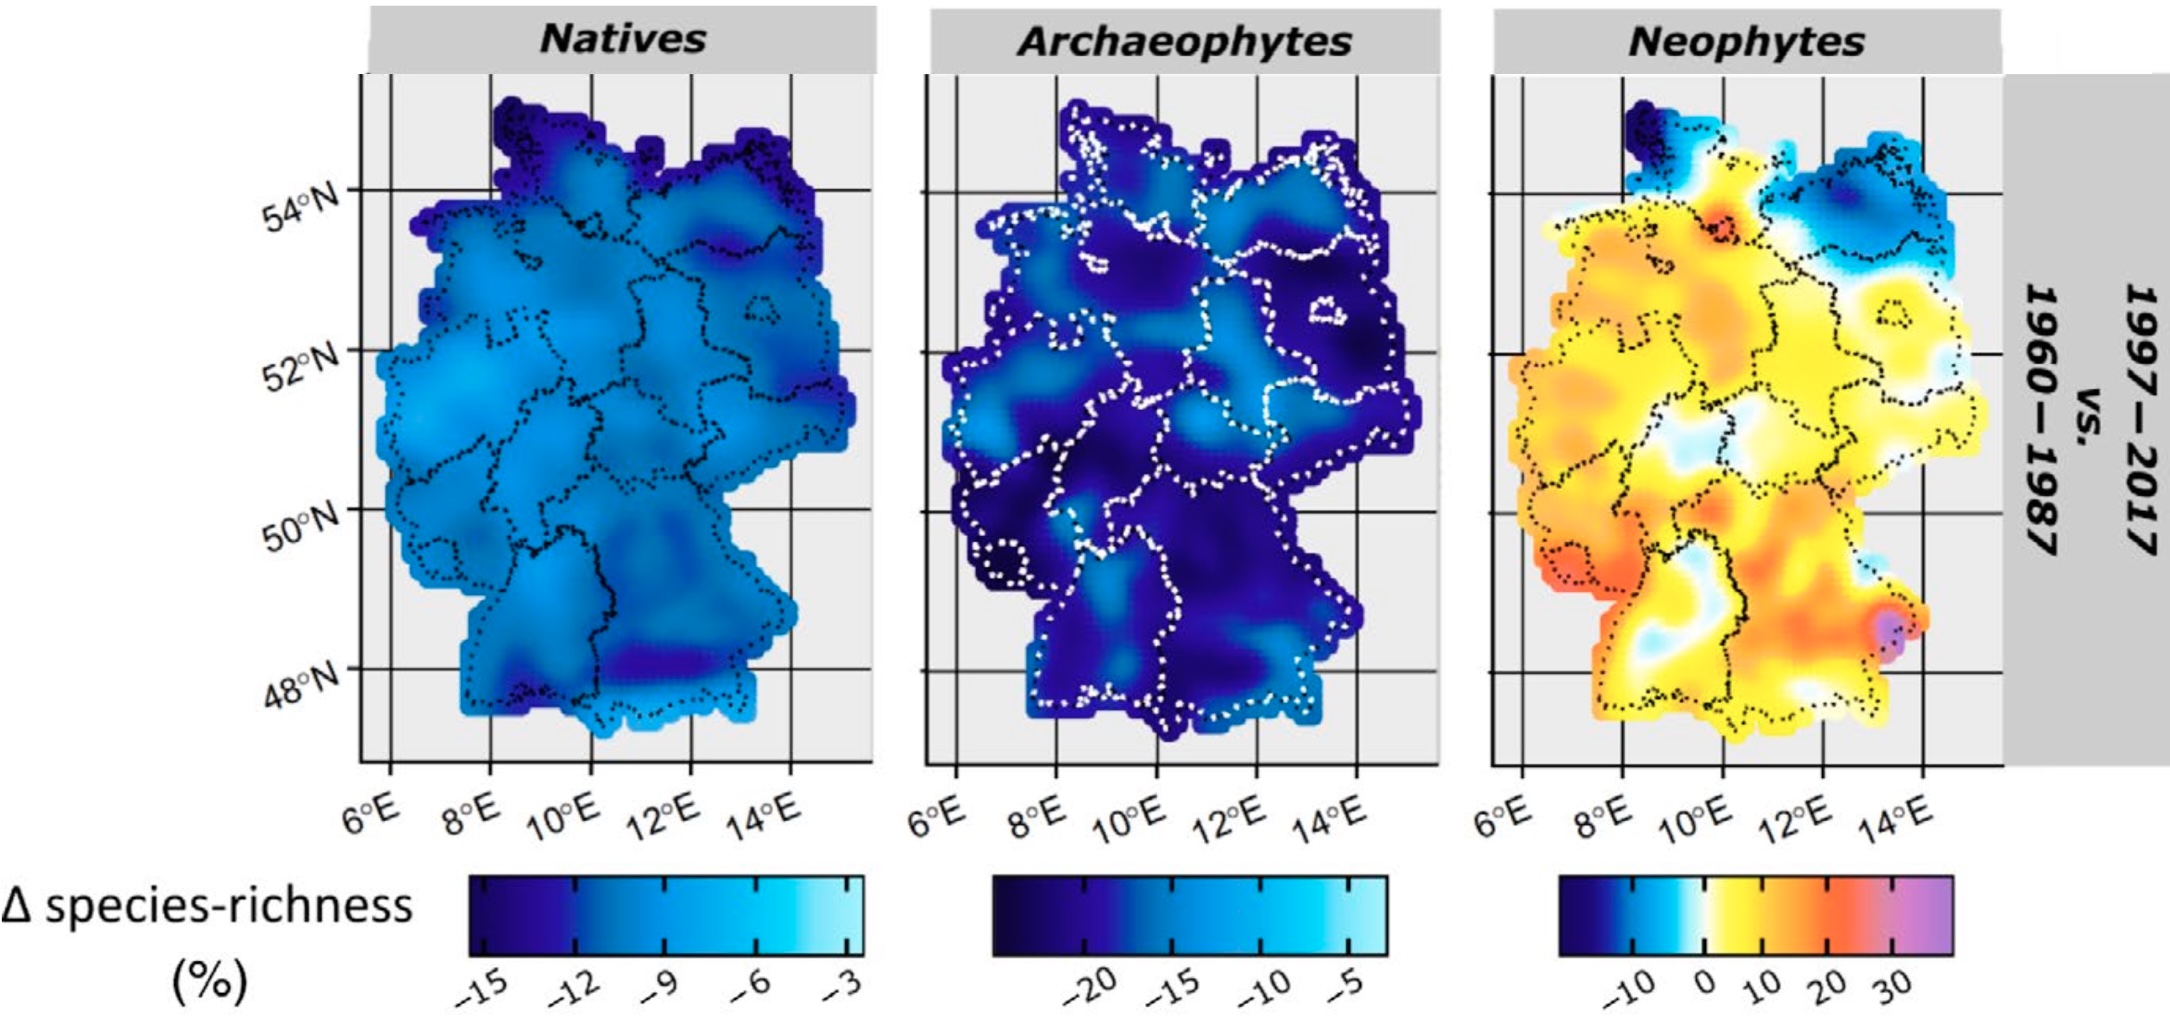
Figure 14 showed that the change in plant biodiversity has been particularly strong in recent time. This is confirmed by a study of changes in plant biodiversity in Germany over six decades from 1960 to 2017 Eichenberg et al. (2021). An analysis of 2,136 plant species showed a decline of more than 70% in nationwide occurrence. The loss was particularly pronounced in native species and archeophytes (species introduced before 1492) whereas there was a strong increase in the diversity of neophytes (Figure 15). However, there was a net decrease of -1.9% per decade in total plant richness which indicates that the loss of diversity is not compensated by neophytes.
In conclusion, the most important cause for change in plant biodiversity was the immigration of neophytes caused by natural events or human activities. Korneck et al. (1998) also investigated the changes in biodiversity caused by human activities and found that the single most important cause for the reduction of plant species in Germany is agriculture (Figure 16).
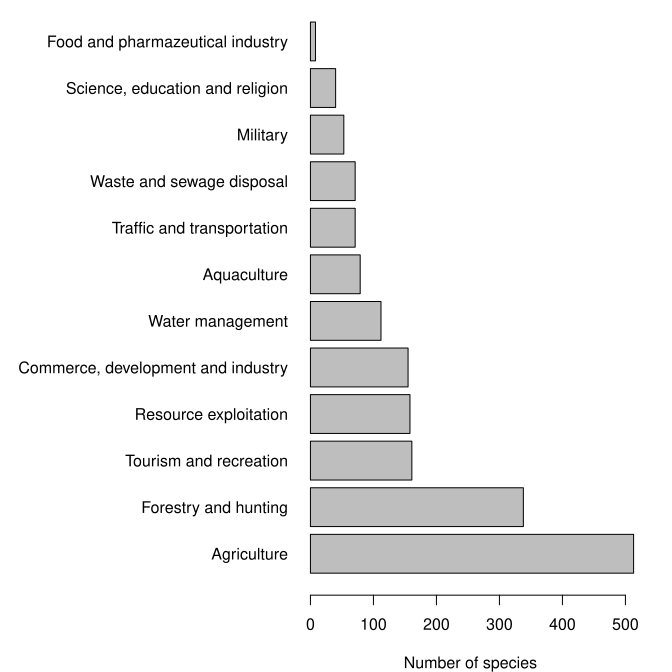
A follow-up study investigated the causes of biodiversity loss caused by agriculture (Korneck et al., 1998). The most important causes were change in land use by habitat conversion of meadows and bogs into agricultural land. Another important cause was the intensification of agriculture. Although these studies are now rather old, recent and larger studies such as meta-analyses of multiple studies confirm these conclusions (Lanz et al., 2018,outhwaite_agriculture_2022). They show a dramatic decline of plant and animal biodiversity on both a global and local level, and identify agriculture and its consequences as a key driver for this decline. One example is a meta-analysis of global insect decline, which found a decrease in abundance by 9% per decade (Klink et al., 2020).
Both habitat conversion and agricultural intensification contribute to the biodiversity loss or genetic erosion (the loss of genetic diversity) on a global scale as was reported by the first report of the FAO on the state of the world’s plant genetic resources (FAO, 1997). It continues to be a problem for a wide diversity of taxa (Newbold et al., 2015) and also affects the wild relatives of crop plants.
A radical change in land use is shown in Figure 17, which demonstrates the conversion of highly diverse and essentially pristine rainforests into a highly industrialized monoculture consisting of soybean.
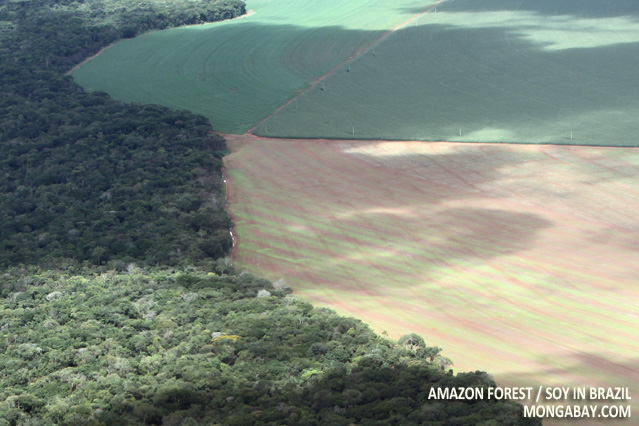
In this system, the change in biodiversity occurs on several levels:
- The highest level is biodiversity due to the destruction of the rainforest.
- The second level is agrobiodiversity because of monoculture and simple crop rotation consisting of soybean and maize.
- The third level is genetic diversity because the soybean cultivated consists of a few hybrid and GMO varieties with a large market share that are all genetically very similar, if not identical.
For this reason, the ongoing change in the conversion of highly diverse landscape is an extreme form of biodiversity loss at multiple levels.
Summary
- The term biodiversity applies to different levels of biological organization of diversity.
- Biodiversity is unequally distributed among taxonomic groups, geographic regions and throughout history.
- Global patterns of biodiversity are highly correlated with diversity of plants used by humans.
- Agrobiodiversity is defined as the diversity in the context of agriculture. Its ultimate purpose is to increase and support human well-being.
- Agriculture one of the most important factors for the decline of total biodiversity. The main cause is different land use, i.e., the conversion of natural to managed ecosystems.
- The conservation of biodiversity is of great importance for agriculture, for example because close wild relatives of crop plants are potentially useful as genetic resources, but may be endangered from extinction.
- On a global scale, agriculture depends mainly on few plant species, but there are numerous crops of local importance, which contribute to local agrobiodiversity.
Key concepts
Further reading
- Hammer et al. (2003) - A good overview on the role of agrobiodiversity in the context of genetic resources
- FAO State of the World’s biodiversity for Food and Agriculture report (2019) - Bélanger et al. (2019) and http://www.fao.org/state-of-biodiversity-for-food-agriculture/en/
- Mace et al. (2014) - The concept of planetary boundaries applied to biodiversity. A powerful and interesting concept, although there is some critical discussion with respect to its practical usefulness, see Geere (2020)
- Current extinction rates approach previous mass extinctions. For a general introduction on the ongoing Sixth extinction that is caused by humans, see the excellent article by Elizabeth Kolbert (Kolbert, 2008), her talk on Youtube (https://www.youtube.com/watch?v=avoq05Z1K6w), or her book The Sixth Extinction - An unnatural history
- A more formal analysis of the biodiversity crisis was published in 2019 by the Intergovernmental Science-Policy Platform on Biodiversity and Ecosystem Services (IPBES) that you can access under this link, and a corresponding publication in Science (Díaz et al., 2019). A short summary, that also makes clear that agriculture is one of the key culprits for the biodiversity crisis was published by Nature (Tollefson, 2019).
- However, it is not all doom and gloom. Andy Purvis makes some recommendations to politics while acknowledging the complexity of the problem (Purvis, 2020).
Study questions
- Which levels of biological organisation are included into the definition of biodiversity? Are all levels relevant for the relationship to agriculture?
- How many species of plants were described, how many are estimated to exist?
- What are centers of biological diversity? Where are the main centers of biodiversity located?
- What is an endemic species?
- Why is the study of general and global patterns of biodiversity relevant for the characterization and use of agrobiodiversity?
- Can you describe the general patterns observed in Figure 6?
- What is the importance of agrobiodiversity in relation to humans?
- What are the different components of agrobiodiversity?
- Why is the study of “negative” agrobiodiversity (i.e., pathogens or insect pests) relevant for the use of “positive” agrobiodiversity?
- What are major and minor crops? Give some examples.
- Which processes lead to the decline of general and agricultural biodiversity?
Thinking and discussion questions
To be added
Problems
- Find out species are defined and whether it matters in the context of biodiversity? For example, is the definition of a species relevant in the context of characterization of biodiversity?
- Kolbert talks about the sixth extinction that we are currently experiencing. When did the previous extinctions occur and what caused them?
- Find out wheter there is a technical definition of ’genetic erosion’ji, which for example is used in the context of (agro-)biodiversity conservation.
- What are planetary boundaries, and how are they defined in the context of biodiversity?
- What are possible conflicts between stakeholders (governments, researchers, companies, farmers, consumers) in the distribution of limited resources if the aim is to improve future food security by a better utilization of agrobiodiversity?
- Are the lesser used crops in section on lesser used crops members of widely distributed or families with smaller species numbers?
- Can you find the FAOSTAT website? What is its purpose?
- Think about the definition of a biological species. How much does the investigation of biodiversity and its value depend on the definition of biological species?
In class exercise
Expanding the context of biodiversity
Each group picks one of the scenarios, discusses it within the group and then presents the results and outcomes in the plenum
Global patterns of biodiversity
- Describe the global patterns of biodiversity as described by Gaston and shown on the slides and the lecture handouts in your own words.
- Could you imagine that it also is relevant for describing the diversity of agricultural diversity or the diversity or plant crops? Collect arguments against and in favor of this diversity
Biodiversity and conservation of plant genetic resources
The scenario: We are currently in the phase of the 6th extinction, which is defined as massive destruction of biodiversity that is caused by humans. The destruction of biodiversity has massive consequences for food security and the maintenance and conservation of plant genetic resources.
Develop arguments why the destruction of biodiversity in general strongly affects the conservation of agrobiodiversity:
- Why does the destruction of (general) biodiversity have strong consequences on the level and conservation of agrobiodiversity?
- What does the conservation of biodiversity mean for crop wild relatives and why is it important?
- Why is the conservation of biodiversity potentially important for the conservation of plant genetic resources?
Future role of orphan crops
Assume that you are a group of consultants and have to write a recommendation to FAO with respect to the support of orphan crops.
Discuss the following arguments with respect to orphan crops:
- What would be the advantage of a globalization of one or more orphan crops?
- What could be potential disadvantages or risks of such a globalization?
- Which resources and efforts would be required to globalize an orphan crop?
- Can you give an example of the advantages and risks of the globalization for a specific orphan crop of your choice?
Crop diversity and stakeholders
With respect to the future of plant breeding and the use of plant genetic resources, the figures on crop diversity and the global area harvested suggest key decisions that need to be taken if available resources are limited:
- Should one focus on improving the three key crops?
- Should the yield of other main crops increased by breeding to make them more competitive to the three major crops?
- Should one breed minor crops into competitive crops so that they can become major crops?
- Is the domestication of new crops an useful strategy?
In the decision that need to be taken, there are several stakeholders who are involved in the improvement and cultivation of crops.
- Political bodies
- Agricultural researchers
- Commercial plant breeders
- Farmers
- Consumers
Collect arguments for each of the five stakeholders in favor or against the four decisions above.