Core collections
Motivation
The evolution of crop plants for hundreds or thousands of years has frequently produced a high level of genetic and phenotypic diversity. It reflects the response to local adaptation to abiotic and biotic environments, cultivation practices and selection of multiple traits by humans. This diversity is of great importance for modern breeding efforts, but evaluation of this diversity in field trials is either impractical, too expensive or not necessary. On the other hand, modern large-scale sequencing methods allow a high-throughput and cost-efficitient characterization of the genetic variation of plant genetic resources.
Ex situ collections in gene banks have grown so large that they are difficult to store, manage and analyse. Therefore, the concept of core collections was proposed in 1984 by O. Frankel [frankel1984genetic] to facilitate the characterization and utilization of these resources by reducing them to a smaller set that has almost the same level of diversity. In his words, he defined them as ‘a limited set of accessions which represents, with a minimum of repetitiveness, the genetic diversity of a crop species and its wild relatives’. After the proposal of this concept, methods and practical aspects for the establishment were developed and published, and the use of core collections is now widely used and recommended.
Core collections facilitate the conservation, regeneration, duplication, documentation, evaluation and the use of plant genetic resources, simply because the number of accessions in a core collection tends to be much smaller than in the complete collection.
Learning goals
- Understand the original and extended definitions of core collections, their purpose in genebank management, and their role in representing genetic diversity efficiently.
- Learn why core collections are essential for improving the usability of plant genetic resources in research and breeding, particularly regarding efficiency, standardization, and resource management.
- Gain knowledge of various methods to build core collections, such as random sampling, structured sampling, clustering, and the use of genetic marker data, and understand when each method is appropriate.
- Comprehend the principles behind the H-strategy and M-strategy for core collection design, including their objectives, applications, and implications for allele diversity and trait evaluation.
Theory of core collections
In the following we will derive the theory of core collections, an understanding of which is required to determine, which size of a collection is required to achieve the intended goals.
Given the importance of genotyping and/or genome sequencing in the characterization of diversity, we will focus exclusively on using genetic diversity for theoretical considerations. Importantly, we will derive the theory from first principles and under somewhat strong assumptions and simplifications.
Characteristics of core collections
Let’s assume that we take a random 10 % sample of your \(N\) diploid individuals (i.e. \(n = 0.1N\)) from the total collection of genebank accessions or another of genetic resources. Then, two main diversity metrics commonly used behave very differently:
Gene diversity (expected heterozygosity, \(H\)) is essentially unbiased and not much affected by this sampling. As we have discussed in , Nei’s classical result shows that the sample estimate of gene diversity \[\begin{equation} H = 1 - \sum_i p_i^2, \end{equation}\] where \(p_i\) are the frequencies of all \(i\) alleles segregating at a locus, is an unbiased estimator of the true \(H\) of a population, provided small-sample correction is applied Nei (1978),DeGiorgio et al. (2010).
In contrast Allelic richness (number of distinct alleles) will decline, especially for rare alleles, because they are not included in a small sample. Under simple binomial sampling of gene-copies, an allele at frequency \(p\) in the base collection has a probability \[\begin{equation} \label{probretained} P_{\text{retained}}(p) \;=\; 1 - (1 - p)^{2n} \end{equation}\] of appearing at least once in your sample of \(n\) diploids (i.e. \(2n\) gene copies1
1 See this vignette on sampling of alleles: CRAN.
This difference has the following implications:
- Alleles with a frequency \(p \gg 1/(2n)\) (common alleles) are almost certain to be retained in the core collection.
- Alleles with \(p \lesssim 1/(2n)\) (rare alleles) have a high loss probability, roughly \((1 - p)^{2n}\approx e^{-2np}\).
Using the following equation, we can calculated the overall expected proportion of alleles retained: \[\begin{equation} \label{fracretained} \frac{A_{\text{sample}}}{A_{\text{total}}} \;=\;\frac{1}{A_{\text{total}}}\sum_{j=1}^{A_{\text{total}}} \Bigl[1 - (1 - p_j)^{2n}\Bigr], \end{equation}\] where \(A_{\text{total}}\) is the number of alleles in the full collection and \(p_j\) their frequencies.
Empirical studies have shown that randomly sampling around 15 % of accessions typically retains \(\ge80\)% of allelic richness, and a 10 % random core is expected to retain on the order of 70–75 % of the original allelic richness Xu et al. (2020).
To summarize the theoretical considerations:
- A 10% random core preserves a very high diversity of ca. 70% gene diversity (heterozygosity).
- However, many of the rarest alleles will be lost: on average only 70–75 % of all alleles are captured unless a method to enrich for rare variants is chosen.
- If the goal is to maximize allelic richness—especially rare alleles, one may want to consider the M-strategy or stratified sampling approaches rather than pure random sampling, that will be presented below.
Methods for the construction of core collections
Depending on the availability of information about the material, different approaches to define a core collection can be taken. Information about the material may include the geographic origin, description of phenotypic traits, or genetic variation.
Random sampling
If limited or no passport information about genebank accessions is available, random sampling of accessions likely captures much of the variation present in a collection. Then the theoretical considerations discussed above are valid and on average, a random sample of 10% of accessions accounts for 70% of variation (measured as Nei’s gene diversity or allelic richness) present in the total collection.
Structured sampling
If additional information is available, e.g., on the genetic diversity, geographic origin, taxonomic classification or phenotypic variation, a more focused or targeted approach is possible as described in the following:
- Identify the complete or partial collection that should be represented by a core collection.
- Decide on the size of the core collection.
- Divide the set of material used into distinct groups (e.g. wild relatives, landraces, improved cultivars).
- Decide on the number of entries per group.
- Choose the entries from each group that will be included in the core.
The different steps can be more or less complex, depending on the information about the collection and its accessions. The grouping of the material can be based on several criteria:
- Geographic origin
- Phenotypic variation
- Genetic variation
- Agronomic characteristics
Several combinations of the criteria may be useful for establishing a core collection, which is then evaluated by researchers or plant breeders. A core collection may be designed to consist of accessions that are maximally variable for one or several criteria using appropriate quantitative descriptors. Alternatively, a collection could consist of a set of accessions from a certain geographic region and/or share a certain agronomic characteristic (i.e., cold hardiness) but otherwise have maximal genetic or phenotypic variation.
The size of a core collection depends on theoretical and practical considerations. Population genetics theory as well as empirical studies allows to examine how many accessions are needed to represent most of the genetic variation in the collection. For example, a random sample of 10% captures on average 70% of the variation present in the total collection. Practical considerations depend on the available budget for the characterization of the accessions.
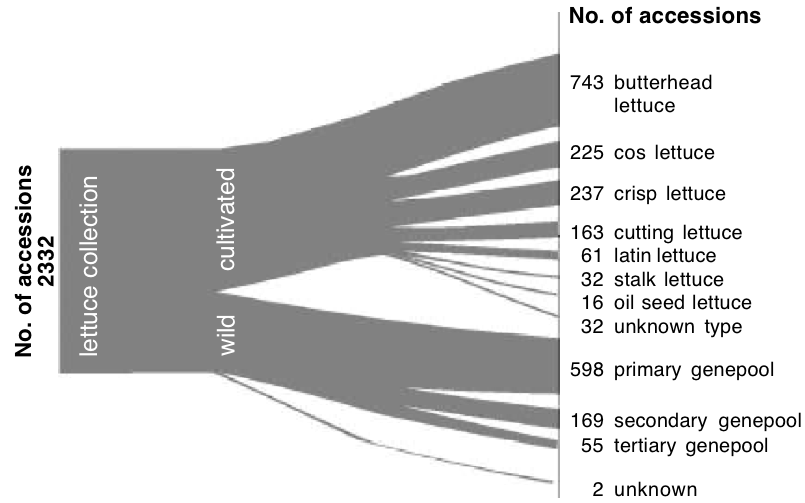
One example for grouping different accessions before including them into the collection is shown in Figure 1, which is based on taxonomy, and additional knowledge about the domestication, distribution, breeding history, cropping pattern and utilization. From this information, a tree is constructed that represents the diversity. This structured approach is also called stratification (Figure 1). The inclusion of external information allows the definition of groups such as Andean highland landraces or beans from short-day, dry, lowland areas in Mexico.
Clustering into groups
Which method is best to cluster the genetic resources into groups? Frequently, multivariate statistical approaches are used to group accessions by one or several characteristics, and then to include representatives of each group into a core collection. The classification can be based on phenotypical and genetic traits. Multiple multivariate methods available for this purpose, and they aim at reducing a complex set of traits or variable into simpler ones. With the availability of genetic marker data, such clustering can now be achieved with methods for the inference of population structure like principal componenents analysis (PCA).
Determining group size
After a definition of groups to be included in a core collection, the size of each group in the core collection needs to be decided. There are several approaches possible. One approach relates the number of accessions from each group in the core collection to the number of accessions in each group of the total collection. The same proportion of accessions from each group is represented in the total core collection (Proportional sampling).
Another approach maximises overall diversity by taking the group structure (stratification) into account (Stratified sampling).
A third approach is more subjective and takes the planned use of the core collection into account (Purpose-oriented sampling). For example, it does not make much sense to include drought-sensitive, cold-sensitive accessions if the goal of a core collection is to breed new drought-resistant, cold-tolerant crop varieties.
Using genetic marker data to define a group structure
In comparison to phenotypic variation, genetic variation is very useful to define core collections that have maximal diversity both within and between groups. Genetic markers have several advantages for this objective:
- They are relatively cheap
- Their trait values (alleles) are indenpendent of environmental effects (in contrast to quantitative phenotypes)
- Genetic distance and variation can be classified with good precision because good statistical measures are available.
Two strategies have been used widely, but more recently other strategies became available (Odong et al., 2013).
The H strategy is utilized to estimate the level of heterozygosity (under the assumption of random mating and full outbreeding) in the core collection. For each marker, a gene diversity index such as Neis gene diversity, \(H\) across markers is calculated. The goal is to maximise average frequencies of alleles.
Theory shows that the relative contribution of each group in the total collection should be in direct proportion to its diversity as measured by the function \(h/(1-h)\) where \(h\) is the average gene diversity across markers for a given population. The advantage of this approach is that a maximal number of different alleles (statistically defined) is contained in the core collection, and that it can be easily applied to collections of variable sizes.
The M strategy focuses on distinct allele types in the data and is deterministic (in contrast to the statistically defined H strategy). It searches for a group of accessions that maximizes the absolute number of observed alleles among genetic markers in a core collection. The total number of accessions is kept to a pre-specified limit and a minimum number of accessions from each group is included. The M strategy guarantees the maximum allelic richness for the marker loci used. In contrast to the H strategy, it also determines the accessions that should be included into the core collection.
Several other methods for identifying core collection based on genetic markers were developed. They are more suitable for large core collections because it can be quite time-consuming to identify the best 2,000 accessions in a collection of 20,000 accessions with the deterministic M strategy because all possible combinations of 2,000 in 20,000 accessions have to be tested. The number of possible combinations approaches infinity in this case.
Distribution of variation in a core collection
The distribution of variation in a core collection can be entirely changed due to selection of accessions for the core collection, as shown in Figure 2.
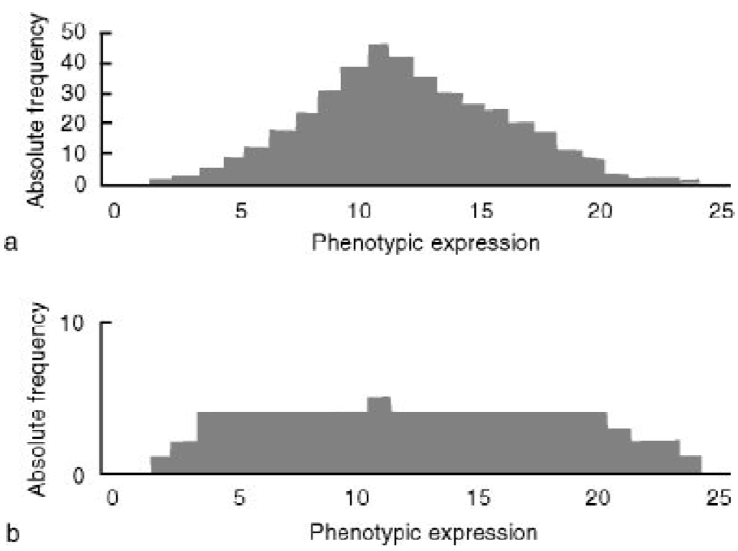
A preliminary evaluation of a core collection can be carried out as a comparison of statistical descriptors like mean, ranges, frequencies and variances of traits and markers between the core and the total collection (or groups within the total collection). It should be noted that the distribution of trait values in a core collection depends on the particular method used for selecting accessions. For example some methods select extreme character states, and accessions with median character traits may be underrepresented.
Examples of core collections
Table 1 shows several established core collections.
| Crop | Core collection | Percent of | Reference |
| size | whole collection | ||
| Foxtail millet (ICRISAT) | \(\sim\) 155 | 10.5% | Upadhyaya et al. (2009) |
| Sorghum landraces | 107 | 3% | Shehzad et al. (2009) |
| Durum wheat (from Spain) | 94 | 17% | Ruiz et al. (2013) |
| Mungbean (AVRDC) | 289 | 4% | Ruiz et al. (2013) |
| Rice (USDA) | 217 | \(\approx\) 1% | Agrama et al. (2009) |
The International Barley Core Collection
One example of a core collections available is the International Barley Core Collection (BCC), which has been established since 1989. It has been designed as a “synthetic” core collection meaning that it was assembled based on taxonomic, geographic, phenotypic and genetic information to optimally represent the diversity of the barley gene pool.
The goals of the collection are to
- increase the efficiency of the evaluation and therefore the utilization of existing collections
- produce a manageable and representative selection of germplasm for research and breeding
- provide adequate material for standardisation in scientific work
- rationalize the search for new traits
- accumulate large quantitities of diverse evaluation results for a limited set of accessions.
The goal of the BCC ist that for any research and breeding activities that relies on genetic material in barley, the BCC should become first choice. The BCC represents a hierarchical structure of the gene pool, and has a total size of <2,000 accessions. The five main categories are shown in Table 2.
| Category | Count |
|---|---|
| Cultivars | 500 |
| Landraces | 800 |
| Wild barley Hordeum vulgare ssp. spontaneum | 150-200 |
| Other wild species (ca. 2 per species) | 60 - 100 |
| Genetic stocks, reference material | <200 |
Propagation by single seed descent, and the creation of doubled haploids ensures the homogeneity of accessions. The advantage is that the accessions are stable, however, because of the hierarchical structure, populations are often represented by single accessions only.
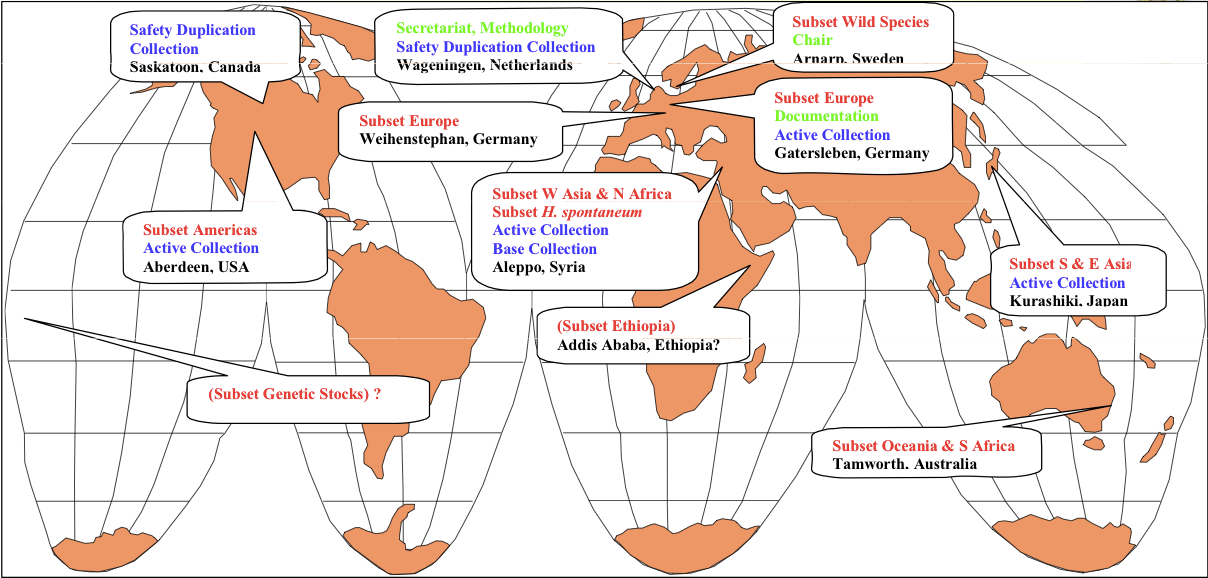
Within the BCC, some subsets are defined ecogeographic considerations and represent cultivars and landraces of certain geographic regions. The subsets are administered by coordinators and there is no single genebank that holds all accessions of the BCC. They have to be ordered from different genebanks. Figure 3 shows the different institutions that are involved in establishing and maintaining the BCC.
The BCC can be accessed on the web via https://www.ipk-gatersleben.de/en/gbisipk-gaterslebendegbis-i/special-collections/.
Key concepts
Summary
- Core collections became very popular for managing ex situ collections because they allow to survey a large proportion of the variation present in a population with a relatively small number of accessions.
- Core collections can be constructed with passport information (geographic origin, etc), phenotypic information and genetic data.
- Several methods were developed to establish core collections based on genetic data, of which the H and the M strategy are the most popular.
- The two strategies differ because they either maximise allelic diversity or allele frequencies.
- Numerous collections such as the international barley core collection have been used in plant research and plant breeding.
Further reading
- van Hintum et al., Core collections of plant genetic resources (2000) IPGRI, Rome. - Available at http://www.bioversityinternational.org/fileadmin/bioversity/publications/pdfs/614.pdf
- Odong et al. (2013) - Very nice and advanced review on core collections
Review questions
- Which approaches are possible to construct core collection, which traits are useful?
- What are the differences, advantages and disadvantages of the H and M strategies for defining core collections?
- What are possible effects on genetic variation, if core collections are selected based on phenotypic variation, and vice versa?
Problems
- Check out at least one of the papers referenced in Table 1. Which strategy was used for the construction of the core collection?
- Collect arguments in favor of the M-strategy and of the S-strategy. Assume that you will characterize the core collection subsequently in the field for interesting phenotypic traits. nCan you image a trade-off between both strategies (Hint: think about the power to identify useful phenotypic variation).