Experimental design
An overview of experimental design
Philosophy of science deals with very fundamental questions on the ability of humans to understand nature and reality, to develop the tools of the scientific method, and to lay out the basis of inductive and deductive logic. In conjunction with probability theory and statistics, the philosophical foundation of the scientific method was used to develop the theory experimental design.
The key issue in an experiment is whether the experimenter has full control over the experimental conditions or not. Therefore the type of scientific studies range from an observational study, where there is no or little control of the experimental conditions to a controlled study in which all conditions are controlled by the experimenter.
These types of experiments differ by two aspects which are crucial for scientific progress:
- Observations of a phenomenon allow a correlation. For example: The identification of a quantitative trait locus (QTL) by correlating genetic polymorphisms with phenotypic variation.
- Manipulation of a phenomenon allows to infer causation. For example: The targeted mutation of a gene using genome editing (CRISPR/Cas9) may change the phenotype of a plant. The outcome of the experiment can be used to determine whether a gene has a certain hypothesized effect on a phenotype.
A main goal of scientific inference is to establish causal relationships. For this reason, any scientific approach that allows to establish causal relationships between entities are preferred, and in many cases required.
Experiments need to be designed
Thre are several myths surrounding the design and analysis experiment that can be summarized in the following two statements:
- Myth 1
- Just collect data, there will always be a statistical procedure that allows you to analyse the data.
- Myth 2
- If you collect enough data there will always be an interesting pattern, and even subtle effects can then be detected.
These statements are, for example, expressed in an article by the technology writer Chris Anderson in the Magazine Wired (Figure 1).
However, one can easily construct examples that show how bad experimental design can lead to incorrect conclusions, as we will discuss in several examples.
History of experimental design
Note: The following section was adapted and modified from Wikipedia.
Arguably the first controlled experimental study was conducted in 1747 by James Lind, who was a Scottish physician and a pionier of naval hygiene in the Royal Navy (Wikipedia), to develop a cure for scurvy (Wikipedia), which was a devastating disease among sailors and results from a lack of Vitamin C.

Lind selected 12 men from among the sailors of a ship, all suffering from scurvy, and divided them into six pairs, giving each group different additions to their basic diet for a period of two weeks. The treatments were all remedies that had been proposed at one time or another. They were:
- A quart of cider every day
- Twenty five gutts (drops) of elixir vitriol (sulphuric acid) three times a day upon an empty stomach
- One half-pint of seawater every day
- A mixture of garlic, mustard, and horseradish in a lump the size of a nutmeg
- Two spoonfuls of vinegar three times a day
- Two oranges and one lemon every day.

The men who had been given citrus fruits recovered dramatically within a week. One of them returned to duty after 6 days and the other became nurse to the rest. The others experienced some improvement, but nothing was comparable to the citrus fruits, which were proved to be substantially superior to the other treatments.
Lind’s experiment already had many features of a modern experimental design. In this study his subjects’ cases “were as similar as I could have them”, that is he provided strict entry requirements to reduce extraneous variation. The men were paired, which provided blocking. From a modern perspective, the main factor that is missing was the randomized allocation of subjects to treatments.
Lind’s experiment showed that in a controlled study it is not necessary to have an explanation how the treatments work (for example, how a half-pint of seawater may treat scurvy). Rather, the experiment was done to find out whether a particular treatment works. Of course, prior information on how a treatment works will improve the design of a study.
Formal criteria on experimental design were first developed by R. A. Fisher in his book The Design of Experiments (1935). This book established the field of design of experiments, DOE that aims at designing optimal scientific experiments given the constraints of available resources and on the other hand to achieve the expected reliability and accuracy of results. DOE includes material experiments and computer simulations.
Basic features of a well designed experiment
A well-designed experiment should have the following, basic features:
- Objectives: The goal of the experiment should be well defined before actually doing the experiment.
- Available resources: The resources should be available to achieve the objectives.
- Representative sampling: In many cases it will be impossible to measure the complete poplation of objects to be studied.
For this reason, a sample has to be taken. The design and acquisition of the sample should be planned in order to represent the population, and it shold be then completely investigated and not just a part of it.
- Controls: In order to study the effect of of a treatment on objects, the experiment should not only include the treatment, or different treatments, but also untreated objects, which allows to analyze the real effects of treatments.
- Distribution of treatments: The sample size should be identical for each treatment.
Principles of experimental design, following Ronald A. Fisher
A methodology for designing experiments was proposed by Ronald A. Fisher, in his book The Design of Experiments (1935). As an example, he described how to test the hypothesis that a certain lady could distinguish by flavour alone whether the milk or the tea was first placed in the cup. While this sounds like a frivolous application, it allowed him to illustrate the most important ideas of experimental design:
- Comparison
- Randomization
- Replication
- Blocking
- Orthogonality
- Factorial experiments
The detailed ideas are outlined as follows:
Comparison
In many fields of study it is hard to reproduce measured results exactly. Comparisons between treatments are much more reproducible and are usually preferable. Often one compares against a standard, scientific control, or traditional treatment that acts as baseline.
For example, in experiments where crop yield is affected (e.g. soil fertility), the experiment can be controlled by assigning the treatments to randomly selected plots of land. This mitigates the effect of different soil composition on the yield.
Randomization
Many hypotheses investigated in scientific studies are compared against the null hypothesis of a random distribution of an effect in a sample. In other words, one tests whether an effect shows some kind of non-random pattern in the sample and compares it against the null hypothesis that says that any pattern present is a chance result of the random distribution of the effect.
Randomization is a technique to test whether the null hypothesis is reasonable in a given study. There is an extensive body of mathematical theory that explores the consequences of making the allocation of units to treatments by means of some random mechanism such as tables of random numbers, or the use of randomization devices such as playing cards or dice. Provided the sample size is adequate, the risks associated with random allocation (such as failing to obtain a representative sample in a survey, or having a serious imbalance in a key characteristic between a treatment group and a control group) are calculable and hence can be managed down to an acceptable level. Random does not mean haphazard, and great care must be taken that appropriate random methods are used.
Randomization is the process of making something random; this means:
- Generating a random permutation of a sequence, such as when shuffling cards.
- Selecting a random sample of a population, which is important in statistical sampling
- Generating random numbers using random number generators
Applications of randomization are the assignment of a treatment to a block in an experiment with a block design. In studies where not all factors are controllable in the experiment, randomization is used to generate a null hypothesis which is used for comparison against the observed data.
One such a test is, for example, whether the genetic population structure and the geographic distribution are correlated or not. This is achieved by randomizing the geographic distribution among individuals and then repeating the correlation again. By repeating this process hundreds and thousands of times, one can ask how often a significant correlation between genetic and geographic distance is observed by chance.
Replication
Measurements are usually subject to variation and uncertainty. Measurements are repeated and full experiments are replicated to help identify the sources of variation and to better estimate the true effects of treatments.
A formal definition of replication is “the repetition of the set of all the treatment combinations to be compared in an experiment. Each of the repetitions is called a replicate.” (according to the American Society for Testing and Materials).
There are two types of replicates biological replicates and technical replicates. Biological replicates are repetitions of the experiments and, whereas technical replicates repeat the measurements of a single experiment. The available resources determine how many biological and technical replicates are necessary for achieving a certain accuracy.
Blocking
Blocking is the arrangement of experimental units into groups (blocks) consisting of units that are similar to one another. Blocking reduces known but irrelevant sources of variation between units and thus allows greater precision in the estimation of the source of variation under study.
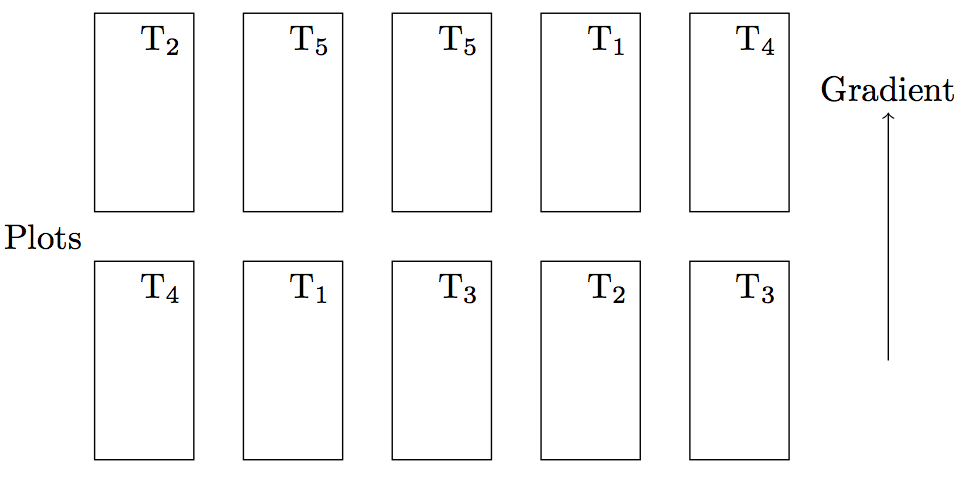
There are different types of blocking design. For example, there is a complete randomized design, where the treatments are completely randomly designed over all individuals (Figure 4).
A better design, however, is the randomized complete block design, where blocks are defined and the treatment is randomly distributed over the blocks (Figure 5). Such a design is more sensitive because the treatment and control group are more similar. In statistical terms, the difference of variances between control and treatment can be given minimum variance (i.e., maximum precision) by maximising their covariance: \[\text{Var}(X-Y) = \text{Var}(X) + \text{Var}(Y) - 2\text{Cov}(X,Y)\]
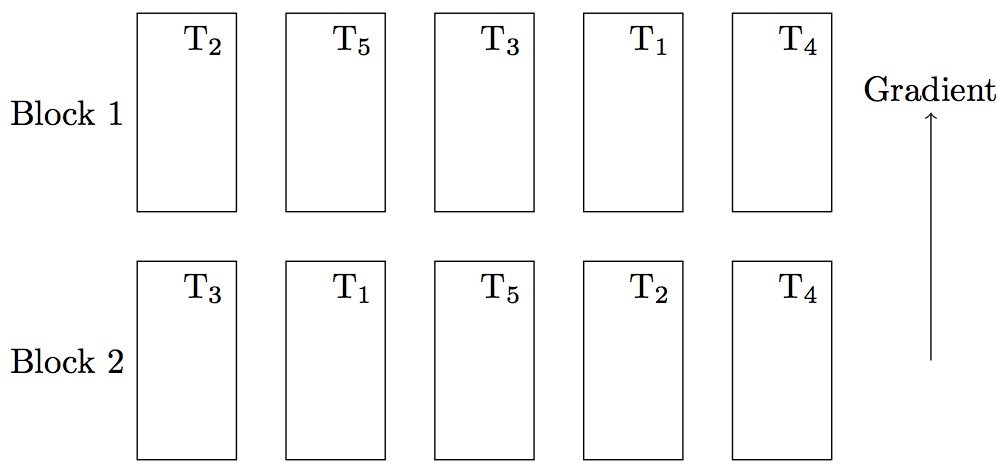
The treatments are completely randomly assigned within blocks. Blocks are defined according to some prior information about environmental gradient.
Orthogonality
Orthogonality concerns the forms of comparison (contrasts) that can be legitimately and efficiently carried out. Contrasts can be represented by vectors and sets of orthogonal contrasts are uncorrelated and independently distributed if the data are normal. Because of this independence, each orthogonal treatment provides different information to the others. If there are \(T\) treatments and \(T – 1\) orthogonal contrasts, all the information that can be captured from the experiment is obtainable from the set of contrasts. One can model the effect of each separately, and then combine these models (adding no extra information) to give a model which predicts the combined effect of varying them jointly.
From a practical point of view, only those treatments that are not correlated can be compared in contrasts, otherwise tests are not independent of each other.
The comparison of contrasts also plays a role in some types of field experiments1. Consider an experiment in which the effect of different herbicides on yield of a crop plant was considered by using the following treatments:
1 Example taken from the book of Clewer and Sarisbrick
- A is a standard weed control herbicide.
- B is a newly approved chemical
- C is the same chemical as B, with an additive for improved weed leaf penetration
- D is the same chemical as B, with the additive and third chemical at a high concentration
- E is the same chemical as B, with the additve and the third chemical at a low concentration.
The orthogonal contrasts are then A vs. B,C,D,E; B vs. C,D,E; C vs. D,E, and D vs. E. A modified ANOVA is possible to calculate the test statistics and to test which of the treatments is effective (See Clewer and Scarisbrick (2013)).
Orthogonality is important important aspect of experimental design because significant associations between treatments may result from cofounding effects. If these effects are known they can be incorporated by defining the appropriate contrasts for comparison.
Factorial experiments
Using of factorial experiments instead of the one-factor-at-a-time method is efficient at evaluating the effects and possible interactions of several factors (independent variables).
Factorial experiments compare treatments, which are combinations of two or more levels of two or more factors. Classifications or categorical variable are factors, and levels are the different values they may take.
In the context of crop sciences, examples of factors are:
- Variety: The different genotypes of a crop plant used in an experiment.
- Fertilizer: The types of fertilizers used.
- Concentration: The different concentrations of fertilizers or other chemicals used.
- Spacing: The level of different spacing between rows or between seeds in a row.
Analysis of the design of experiments was built on the foundation of the analysis of variance, a collection of models in which the observed variance is partitioned into components due to different factors which are estimated and/or tested. The analysis of variance was invented by Fisher to analyse experiments with multiple independent and interacting factors. See Charlesworth and Edwards (2018) for a historical review of Fisher’s contribution to variance analysis in the context of genetics.
Designing an experiment
The design and planning of experiments needs to take the following factors into account:
- The number of factors to investigate (at least two, for example, treatment and control).
- The nature of investigated factors: nominal (qualitative) or quantitative
- Existing information
- The desired reliability and accurracy of conclusions.
Analysis of experiments
The analysis of experiments depends on the nature of factors:
- Nominal (categorical) factors are analysed by using variance analysis.
- With quantitative (metric) factors, the analysis is done with the help of regression analysis.
Summary
- For quantitative experimental design, the principles defined by R. A. Fisher are still valid.
- The key advantages of a well designed experiment are: It is cost-efficient, achieves maximum statistical power given available resources, is based on independent data points and simplifies statistical analysis.
- In molecular biology, which frequently conducts qualitative rather than quantitative experiments, quantitative analysis is less important, instead a carefully designed scheme of control experiments is frequently required.
- According to Fisher, the key components of good experimental design are: Comparison, randomization, replication, blocking, orthogonality and factorial experiments.
- The main statistical tools to analyse experimental designs are regression analyisis and the analysis of variance.
Key concepts
Further reading
- The Wikipedia article on the design of experiments contains further links for additional reading.
- A. G. Clever and D. H. Scarisbrick: Practical Statistics and Experimental Design for Plant and Crop Science. Wiley 2001
- R. A. Fisher: The Design of Experiments (1935). Access via Internet at https://archive.org/details/in.ernet.dli.2015.502684/
There are some very good technical and non-technical books on experimental design:
- Stanley Lazic: Experimental Design for Laboratory Scientists. Maximizing Information and Improving Reproducibility. Cambridge University Press (2016) - Excellent practical introduction to the topic for laboratory scientists
- Nate Silver: The signal and the noise. The art and science of prediction. Penguin Books (2013) - Good and easy to understand introduction into the statistics of data analysis.
- Ben Goldacre: Bad Science. Fourth Estate (2009) - Funny introduction into experimental design and the scientific method.
- Peter Diggle and Amanda Chetwynd: Statistics and the scientific method. Oxford University Press (2011) - No nonsense introduction into the relationship of the experimental design and statistics.
Study questions
- What are key aspects of modern experimental design in Lind’s experiment?
- Why is it not required to know how a treatment works in desperimental design in order to find out whether it works?
- Why does knowledge how a treatment works lead to an improvement of experimental design?
- What are the main components of a well designed experiments according to R. A. Fisher?
- Describe the individual factors that are important for a good experimental design.
- What is the contribution of the different factors in experimental design to improve:
- Accuracy of the experiment
- Robustness of the experiment
- Generality of the conclusions
- Objectivity (Lack of a bias) of the conclusions
- Orthogonality: Why does the herbicide example require the comparison of the contrasts given in the example? What kind of error would be introduced if each combination of herbicides (A to E) would be analyzed as independent treatments?
In class exercises
Group work over several classes
Your tasks
This group work covers the sessions on experimental design. Each group will work on a different experimental design. Each session will have another topic to work on. After a brief introduction into the respective topic or concept, the students will incorporate it into their experimental design. Afterwards, the groups will briefly present how they intend to incoorporate it where each time a different student is expected to do the presentation at the board. This is accompanied by a whole group discussion and constructive feedback to further improve the experimental design.
Topics
Session 1: Research question, objectives and hypotheses
In the first session the students will form groups. Each group will be given one observation. Based on this observation the group will develop a research question, the objectiv(es) of the study, and define the hypotheses. There should be a null hypothesis and at least one alternative hypothesis.
Session 2: Broad design of the study, factors and levels, random variation and confounding factors
In the second session the students will develop the broad design of the study and define the factors and levels. Furthermore the students will identify sources of random variation and identify possible confounding factors. The students will think about how they will deal with them.
Session 3: Pilot study; Replication, pseudoreplicates, and randomisation
In the third session the students will first make a list of open questions and points they need to figure out or test regarding the experimental design, conduction or procedure in general. Then they will design a pilot study that should address and answer all these questions.
Furthermore, the students will focus on replication and randomisation to finalise their experimental design. Replication includes whether there will be temporal or spatial replications, whether there will be biological and technical replicates, and also whether these replicates will be true replicates or rather pseudoreplicates. Regarding randomisation, the students will discuss at which stages randomisation is required (or recommended) and how it will be done.
Session 4
In the last concluding session each group will sum up the experimental design and present it in a brief and concise way.
Use cases for the discussion groups
- A farmer in the South American highlands grows maize. He usually only uses varieties that come from the highlands, but this year he decided to also use some varieties from the lowlands because he was told that those would give more yield. However, it turned out that it was exactly the opposite: the new varieties from the lowlands gave less yield.
- A Chilean farmer grows quinoa on his fields close to the South Pacific coastline. He usually only uses varieties that are locally well established, but this year he decided to also use some varieties from the Andean highlands because he was told that those would give more yield. However, it turned out that it was exactly the opposite: the new varieties from the highlands gave less yield.
- As part of a crop rotation scheme, a farmer grew barley last year for the first time on a certain field on his farm. In comparison to the years before the yield was much less and the leaves had an unusual colour.
- Infection by a certain fungal pathogen is not uncommon in wheat, but last year it was observed that the infection rate was higher under organic than under conventional cultivation.
- A new fertiliser became available to tomato breeders. One breeder used it and saw higher infection by some virus than in previous years.
- Although two neighbouring farmers use the same soybean varieties, they observe differences in growth. The plants grow much faster on the field of farmer 1 than on the field of farmer 2.
- Due to logistic reasons, researchers from the University of Hohenheim had to start a field trial with 50 amaranth accessions six weeks earlier than in the years before. They sowed the same number of seeds per accession as in past years but noticed that there was more variation in the number of plants they had in the end for their trial. In other words for some accessions they ended up with much less plants than for others.