Data science - A short introduction
Motivation
In your scientific research you will most likely a substantial amount of data, which you will analyse in order to test a hypothesis or otherwise improve our scientific knowledge. There are numerous tools available to achieve this goal and deciding on which tool(s) to use may be overwhelming for the beginner.
Learning goals
- Know the definitions of data science
- Understand the importance of data science in modern, evidence-based scientific working
- Know the key principles and tools of data science
What is data science?
The foundation of the modern scientific method with its reliance on induction is evidence-based research. Scientists develop a research question or a hypothesis they intend to test and generate data for further analysis and interpretation. This evidence is then used to either reject hypotheses or make prediction, based on models that were generated by theoretical (deductive) considerations and parameterized using data, or models that were developed directly from the data. Therefore, induction from evidence that is based on data from observations or experiments used to derive general principles for a given research domain.
Working with data is therefore an essential component of scientific working, with the exception of purely theoretical reseach. Today, we are in the era of big data, where modern technologies, e.g., for genotyping and phenotyping of crop plants, as well as computer simulations create large amounts of data that can not be analysed “by hand” any more but require a computer-based workflows and tool chains.
Structure of a data science project
Data science projects follow a more or less similar structure (Figure 1). After data have been generated by you, or someone else, they are usually reformatted (or tidied), transformed into a suitable format for analysis , visualized, analysed with a model and then communicated.
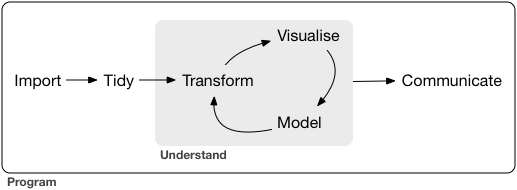
Data need to be imported into an analysis tool, and they may originate from different sources: plain text or data files, a database or a website. In the analysis tool, the data are stored in a specific data structure such as a data frame.
Reformatting or tidying of data is frequently required because the data are structured in a way not optimal for the analysis or because the need to be merged with other data. For example, data are tidy if they are structured in a way that each variable is a column and each row is an observation. Depending on the dataset the tidying of data can be quite elaborate and time consuming.
Transformation makes data suitable for analysis and may involve the transformation of one data structure into another to make it more useful for analysis. This may include the filtering of data to exclude data that are not of interest (because the focus is a certain geographic region), numerical transformations to fulfill requirements such as a normal distribution of the data, imputation of missing data, and calculating a summary statistics like mean and variance, which are then further analysed.
Visualization fulfills several purposes, i.e., to check for data quality and outliers, and to visualize analysis results or to prepare figure for the publication of the results.
Models are mathematical, statistical or computational tools to generalize your data, find useful patterns or abstractions and to establish relationships between your data such as causal relationships between variables. Linear models, e.g., in regression analysis are an example and frequently used in many different areas of data science.
Communication is essential for a summary of your work and the subsequent presentation to others. Also, the importance of communication for one’s own thinking should not be underestimated because having to present ones research in writing and talking, limitations, gaps, and wrong interpretations may be recognized. Communication is done in forms of publication of the raw and processed data, analysis scripts and workflows (for reproducible research) and scientific publications that put the research in a larger context.
Required skills of a data scientist
There is no modern scientific research and data science that does not involve computers. For this reason, a general understanding of principles of computing and to some level, of programming, are very important. It does not mean that one needs to become a fully fledged programmer in order to carry out data science projects. But understanding some key concepts of computer science and programming will make you better and more efficient in what you are doing.
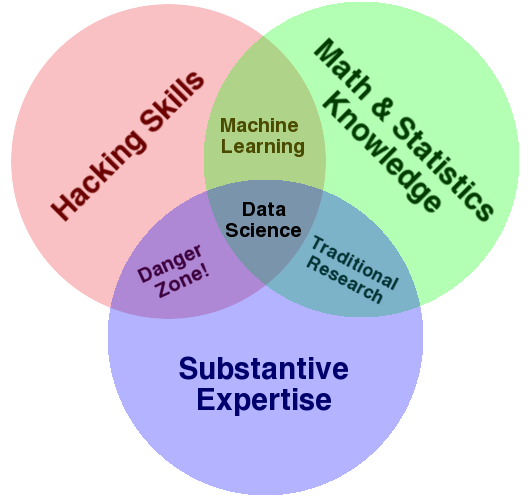
Figure 2 shows that data science skills can be separated in three major domains. The include substantive expertise, which can also be called domain-specific knowledge. In the area of crop science this would include knowledge about crop plants, associated methods and their application in plant breeding and cultivation.
Math and statistics knowledge is required to be able to analyse data. Many of the methods used are generic and can be used in many contexts (e.g., linear mixed models), other are more specific (e.g., test of selection in plant breeding populations).
Hacking skills is a somethat colloquial term for your ability to work with a computer and to write analysis code.
Until recently each of these three skill domains were taught in different courses or even study programs, but now they become more integrated as they increasingly depend on each other. Since available time is limited, there is a trade-off, however, and it is difficult to cover all three domains adequately and sufficiently deep in a single course. For this reason, we provide only an introduction of the most important concepts or methods.
One challenge for beginning data scientists is the requirement to make a choice among the tools and methods used, because quite often there are redundancies. In other words, different tools are available to carry out the same task. In the area of data science the most common computational environments in use are at the moment data analysis tools, i.e., computational notebooks like Jupyter (https://jupyter.org), Quarto (https://quarto.org), or Jupyter Book (https://jupyterbook.org) based on the programming languages R, Python, or Julia are most widely used. They all implement different software paradigms but the key concepts are similar. For this reason, it does not matter so much, which of these you are learning at the beginning of your career as a data scientist because you will likely have to become acquainted with the other and more additional tools if you continue this path.
Key principles useful in data analysis with software packages
In our tutorial on reproducible research we focus on a few key concepts that you should understand and be able to utilize:
- Data import, e.g. from XLSX-formatted files
- Markdown as a simple markup (text-formatting) system
- Programming concepts such as vectors and functions
- Data structures like dataframes
In the course we will not cover (yet) other concepts in data science such as
- SQL databases or other type of databases
- Workflow pipelines such as Snakemake or Nextflow
although they are quite central to many state of the art analysis pipelines.
Summary
- Data science is a general concept for the analysis of data using computational tools and mathematical and statistical approaches
- A set of tools such as computational notebooks exist that greatly facilitate the reproducible analysis of data for scientific research
Key concepts
Further reading
- Nield (2022) - A very good introduction into the generic mathematical skills required in data science with computer exercises in the Python programming language.
Introductory books for the three most important languages: